.jpg)
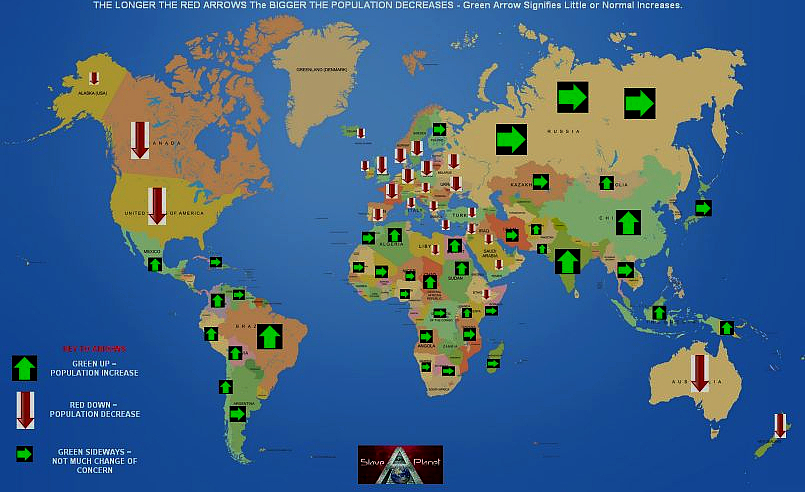
According to the Deagel forecast, America’s population would plummet from just over 310 million in 2017 down to just 99 million in the near future. Western European nations, especially the U.K. and Germany, were forecast to see similarly drastic decreases in population, as were Canada and Australia.
If the Deagel calculations turn out to be even close to accurate, the most unsafe places to live over the next three years will be the United States, Canada and the U.K., followed by Germany, Australia and the rest of the E.U. nations. This population forecast was so controversial, showing population reductions of 68.5 percent in the United States (from 2017 levels) and between 25 and 70 percent for almost every Western European country, that the study mysteriously disappeared from Deagel’s website in March 2021.
But not all areas of the world will continue to decline. Some will actually have larger populations in the near future, according to the Deagel forecast. The safest places to be living would appear to be Central and South America, China and Africa. Interestingly, Russia came in as neutral, not gaining or losing population.
Is this Deagel forecast map a prediction of who will win a future World War III?
Or will a Global Pandemic or maybe a Vaccine be the reason for this!

Historically, a change in the economic paradigm
Deagel organization predicts massive global depopulation of 50 to 80%. Deagel.com
Deagel, a true intelligence organization for the US government, predicted a massive 50-80% global depopulation. Few people are familiar with this website and even more say the organization does not legitimately exist. Despite the overwhelming removal of its significance, WikiLeaks documents revealed that it was legitimately used as a reference material in a Stratfor report on the technological capabilities of the North People's Republic of Korea.
According to its own website, Deagel provides news and information on international military aviation and advanced technologies. The website contains articles from 2003, but little is known about the real owners. Many online researchers have mistakenly confused this site with "deagle.com" which is owned by Edwin A. Deagle, Jr., Assistant to the Secretary of Defense and Assistant Secretary of Defense.
Deagel's reports, particularly the aforementioned research on North Korea, were also provided to the president during presidential briefings. Deagel thus provides information which is then used by global intelligence communities and governments. Here is a partial list of known Deagel partners and customers, according to their own websites: National Security Agency, North Atlantic Treaty Organization (NATO), Organization for Economic Co-operation and Development (OECD), the Organization for Security and Cooperation in Europe (OSCE), the Russian Defense Procurement Agency, Stratfor, the World Bank and the United Nations.
The advantage of these forecasts is that the Deagel site has no conflict of interest in these forecasts. They are literally mercenaries. The site analyzes which budgets will be allocated to which markets to purchase military aircraft. That’s all that really matters to them. These forecasts are based on the reconciliation of various publicly available reports from institutions such as the CIA, the IMF and the UN. They also include a small amount of data from a variety of "dark sources" such as web gurus. But all of these sources are on the internet. The list is constantly evolving. Forecasts of population growth or decline, military spending, and purchasing power parity across countries around the world have fluctuated somewhat, but since 2015 one prediction has not changed: China will be the largest economy on the planet soon.
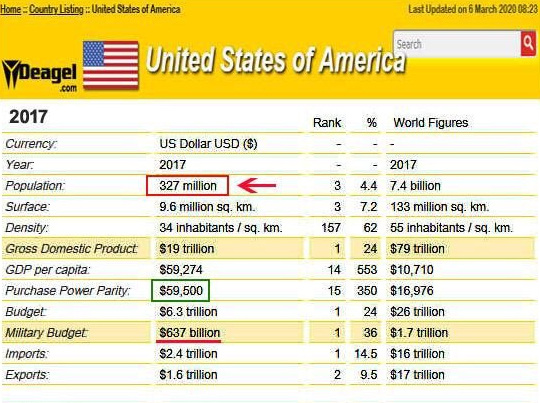
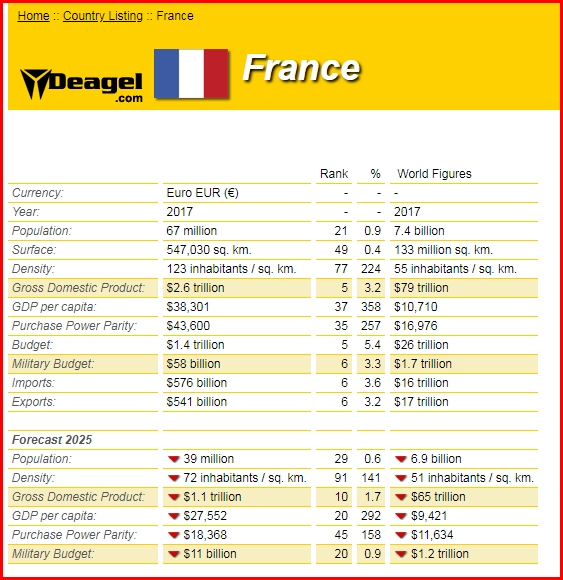
This highly regarded intelligence organization has bleak prospects for the United States in the years to come, including an 81% decline in its population, from 327 million in 2017 to 100 million. In fact, it predicted a similar cataclysmic fate for the UK, Australia, Germany, Japan, Denmark, and other US allies. For example, according to Deagel, the population of France will increase from 67 million inhabitants in 2017 to 39 million, that of England will increase from 66 million to 15 million, that of Australia from 23 million to 15 million. , that of Germany from 81 million to 28 million, while the population of Canada will fall from 36 million in 2017 to 26 million.
To make matters even stranger, a statement on Deagel's predictions page apparently claims that the population movements are due to suicide and assures us that the organization is not "a merchant of death or satanic worship":
“Historically, a shift in the economic paradigm has resulted in a death toll that is seldom highlighted by mainstream historians. When the transition from rural areas to large cities occurred in Europe, many people unable to accept the new paradigm committed suicide. They committed suicide by a psychological factor. This is not common but it is true. A new crisis combines old, well-known models with new ones. We are not a dealer in death or in satanic worship or in weapons as there are rumors floating around the Internet about this. "
“Take into account that the forecast is nothing more than a model, whether it is wrong or correct. It is not the word of God or some magical device that predicts the future. "- Deagel.com
Most of the economic and demographic data used to make the forecasts are widely available from institutions such as the CIA, IMF, UN, US government, etc.
There is a tiny fraction of the data coming from a variety of shadow sources such as internet gurus, unsigned reports and others. But all of these sources come from the Internet and are in the public domain for at least a minority. For example, several years ago, Dagong, the Chinese rating agency, published a report analyzing the physical economy of states by comparing it to that of China, Germany and Japan. The conclusion was that the US GDP was between $ 5,000 and $ 10,000 billion instead of $ 15 trillion, as the USG officially stated. We assume that official data, especially economic data, published by governments are false or distorted to some extent. Historically, it is well known that the former Soviet Union drew up false statistics years before its collapse. The West and other countries are now inventing their numbers to hide their real situation. We are sure that many people can find government statistics in their own country which, through their own personal experience, are hard to believe or are so optimistic that they may belong to another country.
Despite the "quantity" of digital data, there is a "quality" model that does not translate directly into digital data. The 2014 strain of Ebola has a death rate of 50-60%, but try to imagine what would happen if there was an Ebola pandemic with hundreds of thousands or millions of people infected with it. So far, the few cases of people infected with the Ebola virus have “benefited” from intensive health care with antiviral and respiratory assistance, but mostly with abundant human support from doctors and nurses. In a pandemic scenario, this type of health care will not be available for the overwhelming number of infected, leading to a dramatic increase in the death rate due to the lack of appropriate health care. The “quality” factor is that the death rate could increase by 80-90% in a pandemic scenario from the reported rate of 50-60%. The number itself does not matter what is relevant is the fact that the scenario may evolve beyond the initial conditions of a 50% balance sheet to over 90%. By the way, no pandemic or nuclear war is included in the forecast.
Economic Collapse Then Migration?
The key to understanding the process America will enter the next decade is migration. In the past, especially in the 20th century, the key factor that enabled the United States to achieve its status as a colossus was immigration with the benefits of population expansion favoring credit expansion and brain drain. the rest of the world for the benefit of States. The collapse of the Western financial system will wipe out the standard of living of its people while putting an end to ponzi schemes such as the stock market and pension funds. The population will be hit so hard by a full array of bubbles and ponzi schemes that the migration engine will start to work in reverse acceleration due to ripple effects, leading to the demise of states. This situation invisible to states will cascade with unprecedented and devastating effects on the economy. The offshoring of jobs will surely end with many American companies relocating abroad thus becoming foreign companies !!!!
We see a significant portion of the American population migrating to Latin America and Asia while migration to Europe - suffering from a similar illness - will not be relevant. Nonetheless, the death toll will be horrendous. Take into account that the population of the Soviet Union was poorer than Americans today or even then. The ex-Soviets suffered during the next struggle in the 1990s with a significant death toll and loss of national pride. Could we say "twice the pride, twice the fall"? Nope. America's standard of living is one of the highest, well over double that of the Soviets while adding a service economy that will accompany the financial system. When retirees see their retirement disappearing in front of their eyes and there are no service jobs, you can imagine what will happen next. At least young people can migrate. Never in human history have there been so many elders in the population. Over the past centuries, people have been fortunate enough to reach their 30s and 40s. America's downfall is expected to be much worse than that of the Soviet Union. A confluence of crisis with a devastating result.
The demographic crisis in the former Soviet Union countries extended for more than two decades, if we admit that it ended at the beginning of this decade (2010s). The demographic crisis will hit the world in the near future and is expected to last between three and eight decades more or less depending on technological advances and environmental issues. The consequence is more likely a frozen picture with the number of populations remaining the same for a very, very long period of time. Countries expect population figures to reflect births / deaths as well as migratory movements. Many countries will increase their gross populations as a result of immigration while their indigenous populations may decrease.
Over the past two thousand years we have seen Western civilization built around the Mediterranean Sea move to Northern Europe, then in the mid-twentieth century move to an Atlantic axis and finally focus on the United States. United for the past 30 years. The next step will see civilization centered on Asia with Russia and China at the top. Historically, a shift in the economic paradigm has resulted in a death toll that is seldom highlighted by mainstream historians. When the transition from rural areas to large cities occurred in Europe, many people unable to accept the new paradigm committed suicide. They committed suicide by a psychological factor. This is not common but it is true. A new crisis combines old, well-known models with new ones.
Sorry to disappoint many of you with our forecast. They have worsened more and more each year since the start of the pre-crisis in 2007. It is already said that this site is non-profit, built on free time and we provide our information and services AS IS without others. explanations and / or guarantees.
We are not tied to any government in any way. We are not a dealer in death or in satanic worship or in weapons as there are rumors floating around the Internet about this. Be aware that the forecast is nothing more than a model, whether it is wrong or correct. It is not the word of God or some magical device that predicts the future.


There are 179 countries listed with a forecast. Deagel Forecast For USA – Population Drops 70% Deagel.com is a global military intelligence site. They have had an online presence since 2003. They report on high-level military equipment assets and keep track of military expenditures by country “with nearly impeccable numbers”. Population In Millions, Real Gross Domestic Products In USD Billions, Defense Budget In USD Billions, Power Purchase Parity In USD |
2 India 1,341 $7,320 $110 $5,456
3 Russia 141 $6,177 $186 $43,557
4 Brazil 210 $3,241 $37 $15,412
5 Indonesia 267 $2,608 $14 $9,766
6 Japan 103 $2,431 $17 $23,593
7 Mexico 124 $1,711 $6.1 $13,724
8 United States of America 99 $1,630 $32 $16,374
9 Pakistan 218 $1,179 $26 $5,389
10 Iran 81 $1,174 $18 $14,325
11 Thailand 64 $1,126 $11 $17,333
12 Egypt 105 $1,107 $14 $10,514
13 Malaysia 33 $1,031 $10 $30,920
14 Nigeria 187 $1,012 $5 $5,406
15 Philippines 117 $960 $8.3 $8,207
16 Italy 43 $945 $12 $21,600
17 Turkey 71 $833 $9.8 $11,653
18 Saudi Arabia 25 $806 $36 $31,873
19 Colombia 49 $806 $18 $16,388
20 Netherlands 16 $797 $9.7 $47,451
21 South Korea 37 $775 $13 $20,902
22 France 39 $718 $10 $18,368
23 Vietnam 99 $669 $11 $6,762
24 Canada 26 $663 $6.4 $25,208
25 Taiwan 18 $647 $7.3 $34,942
26 Argentina 41 $640 $4.3 $15,621
27 Poland 33 $599 $6.1 $18,036
28 Bangladesh 178 $565 $4.5 $3,173
29 Iraq 33 $514 $21 $15,235
30 Romania 21 $484 $4.4 $23,041
31 Algeria 43 $483 $13 $11,078
32 Chile 18 $482 $7.9 $26,665
33 Germany 28 $413 $2.9 $14,704
34 South Africa 45 $400 $2.3 $8,725
35 Spain 27 $388 $2.1 $13,986
36 Peru 31 $386 $3 $12,101
37 Kazakhstan 18 $315 $1.9 $17,404
38 Czechia 9.9 $302 $2.1 $30,589
39 Morocco 33 $298 $7.1 $8,853
40 Australia 15 $280 $2.8 $18,441
41 Myanmar 58 $278 $5 $4,749
42 Venezuela 29 $267 $1.7 $9,132
43 Hungary 9.4 $258 $1.5 $27,587
44 Singapore 5 $252 $4.2 $50,863
45 Sri Lanka 22 $241 $3.7 $10,577
46 Ethiopia 100 $238 $1.3 $2,369
47 Finland 5.3 $215 $3.6 $40,857
48 Belgium 8.1 $207 $1.9 $25,767
49 Kenya 50 $180 $2.1 $3,595
50 Dominican Republic 11 $177 $0.7 $15,766
51 Portugal 8.1 $172 $2.2 $21,230
52 Sudan 40 $168 $2.8 $4,149
53 Austria 6.2 $167 $1.1 $26,908
54 Afghanistan 33 $165 $6.3 $4,924
55 Ukraine 31 $164 $2.4 $5,188
56 Uzbekistan 30 $164 $3.2 $5,389
57 Ecuador 15 $164 $2.7 $10,599
58 Azerbaijan 9.6 $158 $4.9 $16,456
59 Sweden 7.2 $157 $1.4 $21,958
60 Slovakia 5.1 $147 $1.1 $29,069
61 Switzerland 5.3 $144 $0.7 $27,124
62 United Kingdom 14 $131 $1.4 $9,068
63 Greece 8.1 $129 $2 $16,105
64 Bulgaria 6.1 $127 $1.2 $20,767
65 Angola 19 $125 $4.1 $6,437
66 United Arab Emirates 4.7 $124 $4.8 $26,651
67 Lebanon 6.6 $120 $3.3 $18,333
68 Oman 3.6 $119 $7.4 $33,011
69 Norway 3.8 $115 $1.5 $30,188
70 Guatemala 16 $112 $0.3 $6,630
71 Tanzania 42 $111 $0.8 $2,611
72 Cuba 10 $110 $3.2 $10,190
73 Cote d'Ivoire 25 $104 $1.1 $4,092
74 Ghana 27 $100 $0.3 $3,590
75 Denmark 3.8 $94 $1 $25,057
76 Cameroon 24 $94 $0.9 $3,872
77 Qatar 1.8 $91 $3.4 $51,731
78 Belarus 7.9 $86 $0.5 $10,968
79 Turkmenistan 5.6 $82 $1.5 $14,774
80 Bolivia 11 $82 $0.8 $6,846
81 Kuwait 2.4 $81 $2.9 $34,104
82 Nepal 33 $81 $0.8 $2,421
83 Panama 3.8 $79 $0.4 $20,694
84 Costa Rica 5.2 $78 $ $15,199
85 Tunisia 10 $77 $0.6 $7,258
86 Lithuania 2.7 $73 $0.6 $27,174
87 Croatia 3.8 $70 $0.7 $18,850
88 Cambodia 17 $69 $0.9 $3,998
89 Uganda 36 $68 $0.7 $1,877
90 Serbia 6 $63 $0.6 $10,717
91 Democratic Republic of Congo 81 $63 $0.7 $776
92 Jordan 6.9 $62 $1.6 $9,144
93 Paraguay 7.2 $62 $0.7 $8,679
94 Syria 16 $61 $4.4 $3,812
95 Yemen 27 $59 $1.3 $2,172
96 New Zealand 3.3 $48 $0.3 $14,711
97 Slovenia 1.7 $47 $0.4 $27,708
98 Israel 4 $46 $1.7 $11,798
99 Zambia 15 $44 $0.4 $2,886
100 Senegal 14 $44 $0.5 $3,066
101 Laos 7.7 $44 $0.1 $5,844
102 Latvia 1.8 $43 $0.4 $24,795
103 El Salvador 5.3 $42 $0.3 $7,965
104 Honduras 9.8 $42 $0.3 $4,282
105 Gabon 1.9 $41 $0.4 $21,794
106 Mali 16 $40 $0.5 $2,472
107 Burkina Faso 18 $40 $0.4 $2,209
108 Republic of the Congo 5.3 $37 $0.6 $7,128
109 Botswana 2.3 $36 $0.6 $16,155
110 Georgia 4.7 $36 $0.6 $7,770
111 Bosnia and Herzegovina 3.6 $35 $0.3 $9,756
112 Albania 2.8 $35 $0.3 $12,485
113 Rwanda 12 $33 $0.3 $2,572
114 Brunei Darussalam 0.4 $32 $0.6 $73,859
115 Mozambique 26 $31 $0.2 $1,229
116 Chad 12 $31 $0.5 $2,538
117 Uruguay 2.8 $30 $0.5 $10,761
118 Mongolia 3.1 $30 $0.2 $9,772
119 Madagascar 24 $28 $0.1 $1,139
120 Nicaragua 6.2 $27 $0.1 $4,466
121 North Macedonia 1.9 $27 $0.2 $14,380
122 Benin 10 $27 $0.2 $2,600
123 Tajikistan 9.2 $25 $0.2 $2,732
124 Papua New Guinea 7.6 $23 $0.1 $3,065
125 Mauritius 1.4 $23 $0 $17,566
126 Niger 17 $23 $0.4 $1,321
127 Jamaica 2.8 $21 $0.1 $7,612
128 Zimbabwe 14 $21 $0.3 $1,492
129 Estonia 0.9 $20 $0.4 $21,806
130 Namibia 2.3 $20 $0.5 $8,550
131 Armenia 2.9 $20 $0.5 $6,938
132 Bahrain 0.8 $17 $0.4 $20,778
133 Ireland 1.3 $16 $0 $12,355
134 Trinidad and Tobago 1 $16 $0.1 $16,041
135 Cyprus 0.8 $15 $0.2 $19,087
136 Equatorial Guinea 0.7 $15 $0 $22,236
137 Kyrgyzstan 5.8 $14 $0.1 $2,455
138 Mauritania 3.8 $14 $0.4 $3,715
139 Guinea 11 $13 $0.1 $1,137
140 Malawi 17 $13 $0.1 $789
141 Togo 7.5 $13 $0.2 $1,860
142 Libya 3.3 $11 $ $3,513
143 Montenegro 0.6 $11 $0.1 $18,861
144 Timor-Leste 1.4 $11 $0.2 $8,360
145 Haiti 9.4 $10 $ $1,152
146 Burundi 10 $9.9 $0.2 $941
147 Moldova 2.8 $9.5 $0 $3,463
148 Eswatini 1.4 $9.5 $0.1 $6,989
149 Sierra Leone 5.9 $8.2 $0 $1,390
150 Suriname 0.5 $7.4 $0 $13,621
151 Fiji 0.9 $7.1 $0.1 $7,847
152 Eritrea 6 $6.3 $0.2 $1,046
153 Guyana 0.7 $6.3 $0.1 $8,679
154 Malta 0.3 $6.2 $0 $21,156
155 Maldives 0.4 $6.2 $0.1 $15,824
156 Bhutan 0.8 $5.9 $ $7,515
157 Bahamas 0.3 $5 $ $18,312
158 Cape Verde 0.6 $4.4 $0 $7,725
159 Somalia 9.9 $4.3 $ $430
160 Central African Republic 6 $4.2 $0 $694
161 Djibouti 0.9 $4.1 $0.1 $4,653
162 Luxembourg 0.2 $3.9 $0 $19,402
163 Lesotho 1.7 $3.6 $0 $2,057
164 Guinea-Bissau 2 $3.6 $0.1 $1,821
165 Barbados 0.2 $3 $ $12,857
166 Iceland 0.2 $2.8 $0 $14,185
167 Belize 0.4 $2.7 $0 $7,671
168 Gambia 2 $2.6 $0 $1,303
169 Liberia 3.8 $2.4 $0 $627
170 Grenada 0.1 $1.9 $ $17,098
171 Comoros 0.9 $1.8 $0 $2,020
172 Solomon Islands 0.7 $1.8 $0 $2,734
173 Saint Lucia 0.1 $1.4 $ $10,978
174 Samoa 0.2 $1.4 $ $7,124
175 Saint Vincent and the Grenadines 0.1 $1.3 $ $12,884
176 Sao Tome and Principe 0.2 $0.8 $ $3,418
177 Tonga 0.1 $0.7 $ $6,645
178 Kiribati 0.1 $0.4 $ $3,483
179 Micronesia 0.1 $0.3 $ $3,282
Disclaimer*
In 2014 Deagel.com published a disclaimer about the forecast. Stating in six years the scenario had changed dramatically. This new disclaimer is meant to single out the situation from 2020 onwards. Talking about the United States and the European Union as separated entities no longer makes sense. Both are the Western block, keep printing money and will share the same fate.
After COVID we can draw two major conclusions:
- The Western world success model has been built over societies with no resilience that can barely withstand any hardship, even a low intensity one. It was assumed but we got the full confirmation beyond any doubt.
- The COVID crisis will be used to extend the life of this dying economic system through the so called Great Reset.
The Great Reset; like the climate change, extinction rebellion, planetary crisis, green revolution, shale oil (…) hoaxes promoted by the system; is another attempt to slow down dramatically the consumption of natural resources and therefore extend the lifetime of the current system. It can be effective for awhile but finally won’t address the bottom-line problem and will only delay the inevitable. The core ruling elites hope to stay in power which is in effect the only thing that really worries them.
The collapse of the Western financial system - and ultimately the Western civilization - has been the major driver in the forecast along with a confluence of crisis with a devastating outcome. As COVID has proven Western societies embracing multiculturalism and extreme liberalism are unable to deal with any real hardship. The Spanish flu one century ago represented the death of 40-50 million people. Today the world’s population is four times greater with air travel in full swing which is by definition a super spreader. The death casualties in today’s World would represent 160 to 200 million in relative terms but more likely 300-400 million taking into consideration the air travel factor that did not exist one century ago. So far, COVID death toll is roughly 1 million people. It is quite likely that the economic crisis due to the lockdowns will cause more deaths than the virus worldwide.
The Soviet system was less able to deliver goodies to the people than the Western one. Nevertheless Soviet society was more compact and resilient under an authoritarian regime. That in mind, the collapse of the Soviet system wiped out 10 percent of the population. The stark reality of diverse and multicultural Western societies is that a collapse will have a toll of 50 to 80 percent depending on several factors but in general terms the most diverse, multicultural, indebted and wealthy (highest standard of living) will suffer the highest toll. The only glue that keeps united such aberrant collage from falling apart is overconsumption with heavy doses of bottomless degeneracy disguised as virtue. Nevertheless the widespread censorship, hate laws and contradictory signals mean that even that glue is not working any more. Not everybody has to die migration can also play a positive role in this.
The formerly known as second and third world nations are an unknown at this point. Their fate will depend upon the decisions they take in the future. Western powers are not going to take over them as they did in the past because these countries won’t be able to control their own cities far less likely countries that are far away. If they remain tied to the former World Order they will go down along Western powers but won’t experience the brutal decline of the late because they are poorer and not diverse enough but rather quite homogenous used to deal with some sort of hardship but not precisely the one that is coming. If they switch to China they can get a chance to stabilize but will depend upon the management of their resources.
We expected this situation to unfold and actually is unfolding right now with the November election triggering a major bomb if Trump is re-elected. If Biden is elected there will very bad consequences as well. There is a lot of bad blood in the Western societies and the protests, demonstrations, rioting and looting are only the first symptoms of what is coming. However a new trend is taking place overshadowing this one.
The situation between the three great powers has changed dramatically. The only relevant achievement of the Western powers during the past decade has been the formation of a strategic alliance, both military and economic, between Russia and China. Right now the potential partnership between Russia and the European Union (EU) is dead with Russia turning definitively towards China. That was from the beginning the most likely outcome. Airbus never tried to establish a real partnership but rather a strategy to fade away the Russian aerospace industry. Actually Russia and China have formed a new alliance to build a long haul airliner. Western Europe (not to mention the United States) was never interested in the development of Russia or forming anything other than a master slave relationship with Russia providing raw materials and toeing the line of the West. It was clear then and today is a fact.
Russia has been preparing for a major war since 2008 and China has been increasing her military capabilities for the last 20 years. Today China is not a second tier power compared with the United States. Both in military and economic terms China is at the same level and in some specific areas are far ahead. In the domain of high-tech 5G has been a success in the commercial realm but the Type 055 destroyer is also another breakthrough with the US gaining a similar capability (DDG 51 Flight IIII) by mid of this decade (more likely by 2030). Nanchang, the lead ship of the Type 055 class, was commissioned amid the pandemic and lockdown in China.
Six years ago the likelihood of a major war was tiny. Since then it has grown steadily and dramatically and today is by far the most likely major event in the 2020s. The ultimate conflict can come from two ways. A conventional conflict involving at least two major powers that escalates into an open nuclear war. A second scenario is possible in the 2025-2030 timeframe. A Russian sneak first strike against the United States and its allies with the new S-500, strategic missile defenses, Yasen-M submarines, INF Zircon and Kalibr missiles and some new space asset playing the key role. The sneak first strike would involve all Russian missile strategic forces branches (bombers and ground-based missiles) at the different stages of such attack that would be strategic translation of what was seen in Syria in November 2015. There was no report that the Russian had such a capability of launching a high precision, multiple, combined arms attack at targets 2,000+ kilometers away. Western intelligence had no clue. The irony is that since the end of the Cold War the United States has been maneuvering through NATO to achieve a position to execute a first strike over Russia and now it seems that the first strike may occur but the country finished would be the United States.
Another particularity of the Western system is that its individuals have been brainwashed to the point that the majority accept their moral high ground and technological edge as a given. This has given the rise of the supremacy of the emotional arguments over the rational ones which are ignored or deprecated. That mindset can play a key role in the upcoming catastrophic events. At least in the Soviet system the silent majority of the people were aware of the fallacies they were fed up. We can see the United States claims about G5 being stolen from them by China or hypersonic technology being stolen by Russia as the evidence that the Western elites are also infected by that hubris. Over the next decade it will become obvious that the West is falling behind the Russia-China block and the malaise might grow into desperation. Going to war might seem a quick and easy solution to restore the lost hegemony to finally find them into a France 1940 moment. Back then France did not have nuclear weapons to turn a defeat into a victory. The West might try that swap because the unpleasant prospect of not being Mars and Venus but rather a bully and his dirty bitch running away in fear while the rest of the world is laughing at them.
If there is not a dramatic change of course the world is going to witness the first nuclear war. The Western block collapse may come before, during or after the war. It does not matter. A nuclear war is a game with billions of casualties and the collapse plays in the hundreds of millions.
UK, US, and Germany look to be “epicenters of slaughter”
Researcher Craig Paardekooper released this report on predictions of global population reduction from military analysis website Deagel.com.
Paardekooper’s article links mass slaughter to vaccines in countries inhabited mainly by White people of European descent.
Quote:
Deagel.com provided the forecast for population of each country. I obtained their forecast data before it was taken down in April of this year. However, the data had been safely archived and was still available for analysis.
I calculated the % population reductions for each country based on the difference between the current population and the forecast, and rank sorted each country in order of largest population reduction.
My hypothesis was that the cull would have an epicentre, centred in the countries/ powers who were running the pandemic – namely the G7.
I also hypothesised that those countries making the vaccines would right at the heart of the slaughter.
Observations
1. The G7 countries are clustered near the top of the list – their % population reductions are:
a. UK - 78.5%
b. USA - 70.2%
c. Germany - 65%
d. France - 41.8%
e. Italy - 30.6%
f. Canada - 29.7%
g. Japan - 17.6%
2. Three countries dominate the top positions:
a. UK
b. USA
c. Germany
These are the very 3 countries involved in the production of the vaccines: Astrazeneca, Moderna and Pfizer vaccines
If Deagel is an accurate forecast, then:
1. It is extremely dangerous to stay in UK, USA or Germany – the epicentres of this slaughter – the places where they make the vaccines (4 in 5 will die here).
2. G7 countries in general are a bad idea (1 in 3 will die at best).
3. European countries in general are unsafe.
4. The Eastern European countries appear to be the safer - Romania, Belize, Chechia, Lithuania, Finland, Hungry, Latvia.
5. There [is] quite a number of countries where there is no culling.
In Summary
It is advised that people temporarily distance themselves from UK, USA and Germany. These governments are planning the utter destruction of their own populations. And most are complying — it is almost like a suicide cult.
China comes in far down the list with just a 2.3% predicted reduction in population, from 1.390 billion to 1.358 billion people.
Population projections 2004-2050
EU25 population rises until 2025, then falls
Working age population expected to decrease by 52 million by 2050
Over the next two decades the total population of the EU25 is expected to increase by more than 13 million inhabitants, from 456.8 million on 1 January 2004 to 470.1 million on 1 January 2025 . Population growth in the EU25 until 2025 will be mainly due to net migration, since total deaths in the EU25 will outnumber total births from 2010. The effect of net migration will no longer outweigh the natural decrease after 2025, when the population will start to decline gradually. The population will reach 449.8 million on 1 January 2050 , that is a decrease of more than 20 million inhabitants compared to 2025 . Over the whole projection period the EU25 population will decrease by 1.5%, resulting from a 0.4% increase for the EU15 and a 11.7% decrease for the ten new Member States.
The share of the population of working age (between 15 and 64 ) in the total population is expected to decrease strongly in the EU25, from 67.2% in 2004 to 56.7% in 2050 , that is a fall of 5 2 million inhabitants of working age .
The share of the population aged between 0 and 14 will also be reduced , from 16.4% in 2004 to 13. 4% in 2050, while the proportion of elderly people (aged 65 and more) is expected to almost double over this period, from 16.4% in 2004 to 29.9% in 2050.
This information on population projections 1 in the EU25, Bulgaria and Romania, issued by Eurostat, the Statistical Office of the European Communities , has been derived from the analysis and extrapolation of demographic trends. Given the length of the projection period, results should be considered with caution.
Largest declines in most of the new Member States
In 2004 the population is estimated to have decreased in seven Member States ( the Czech Republic , Estonia, Latvia, Lithuania, Hungary, Poland and Slovakia). By 2025 the population will decrease in another six ; Italy (from 2013) , Germany and Slovenia (both 2014) , Portugal (2018), Greece (2020) and Spain ( 2022). By 2050, twenty Member States are expected to register a decline in their population; the previous thirteen plus Finland (from 2028), Austria (2029), Denmark (2032), the Netherlands (2036), Belgium (2037), the United Kingdom (2040) and France (2042). The population will still be increasing in Ireland, Cyprus, Luxembourg, Malta and Sweden.
Between 2004 and 2050 , the largest declines are expected to be observed in most of the new Member States : Latvia ( -19.2%), Estonia (-16.6%), Lithuania (-16.4%), the Czech Republic (-12.9%), Hungary and Slovakia (both -11.9%), and Poland ( -11.8%). Over the whole period, the strongest increases will be recorded in Luxembourg (+42.3%), Ireland (+36.0%), Cyprus (+33.5%) and Malta (+27.1%).
In absolute terms the largest population decreases are expected in Germany (-7.9 million), followed by Italy (-5.2 million) and Poland ( -4.5 million) , while the highest rises are expected in France (+ 5.8 million) , the United Kingdom (+4.7 million) and Ireland (+1.5 million).
Number of adults and young people down by 67 million by 2050
The proportion of the population in working age (between 15 and 64) is expected to decline sharply in the long run.
In the EU25 it will pass from 67.2% in 2004 to 56.7% in 2050, i.e. in absolute terms from 306.8 million in 2004 to 254.9 million in 2050. In 2050 the lowest shares of the population of working age will be observed in Spain (52.9%), Italy ( 53.5%), Portugal (55.0%) and Greece (55.2%) and t he highest in Luxembourg (61.3%), Malta (60.8%) and the Netherlands (60.7%).
The share of the EU25 population aged between 0 and 14 will decrease from 16.4% in 2004 to 13.4% in 2050. The largest decreases will be recorded in Cyprus (from 20.0% to 13.3%) and Ireland (from 20.9% to 16.0%). In 2050 the proportion of young people will range between 11.2% in Italy and 16.6% in Luxembourg.
More than 10% of the population aged 80 or over in 2050
On the other hand, the proportion of elderly people (aged 65 and more) is expected to rise substantially throughout the whole projection period. In the EU25 it will increase from 16.4% in 2004 to 29.9% in 2050, or from 75.3 million in 2004 to 134.5 million in 2050. The largest shares of elderly people in 2050 are expected in Spain (35.6%), Italy (35.3%), and Greece (32.5%), and the lowest in Luxembourg (22.1%), the Netherlands (23.5 %) and Denmark (24.1%).
The proportion of very o ld people (aged 80 and more) is expected to almost triple in the EU25, from 4.0% in 2004 to 11.4% in 2050, with the highest proportions expected in Italy (14.1%), Germany (13.6%) and Spain (12.8%).
As a consequence, the elderly dependency ratio 2 in the EU25 will rise from 24.5% in 2004 to 52.8% in 2050, while the young dependency ratio 3 would remain more or less constant throughout the projection period, passing from 24.4% in 2004 to 23.7% in 2050. The total dependency ratio 4 in the EU25 would increase from 48.9% in 2004 to 76.5% in 2050. This means that whereas in 2004 there was one inactive person ( young or elderly) for every two persons of working age, in 2050 there would be three inactive persons for every four of working age.
1. The Eurostat set of population projections is just one among several scenarios of population evolution based on assumptions of fertility, mortality and migration. The current trend scenario does not take into account any future measures that could influence demographic trends and comprises four variants: the ‘baseline’ variant presented in this News Release, as well as 'high population', 'low population' and 'zero -migration' variants, all available on the Eurostat website . It should be noted that the assumptions adopted by Eurostat may differ from those adopted by National Statistical Institutes (for example, assumptions about migration levels in Italy and Slovenia). Therefore, the results published by Eurostat can be different from those published by Member States.
2. Population aged 65 and more as a percentage of population aged between 15 and 64.
3. Population aged between 0 and 14 as a percentage of population aged between 15 and 64.
4. Sum of young and elderly dependency ratios.
5. Data for France refer to metropolitan France.
Issued by:
Eurostat Press Office:
Philippe BAUTIER
BECH Building
L-2920 Luxembourg
Tel: +352-4301-33 444
Fax: +352-4301-35 349
eurostat-pressoffice@cec.eu.int
Eurostat news releases on the Web:
http://europa.eu.int/comm/eurostat/
For further information:
Giampaolo LANZIERI
Fabio SARTORI
Konstantinos GIANNAKOURIS
Tel: +352-4301-35 336
Fax: +352-4301-36 049
giampaolo.lanzieri@cec.eu.int
fabio.sartori@cec.eu.int
konstantinos.giannakouris@cec.eu.int
Total population
Population at 1 January
(1000 inhabitants)
Percentage increase with
respect to 1.1.2004
2004 2015 2025 2050 2015 2025 2050
EU25 456 815 467 307 470 057 449 831 2.3 2.9 -1.5
EU15 382 674 394 727 398 780 384 356 3.1 4.2 0.4
New Member States 74 141 72 580 71 278 65 475 -2.1 -3.9 -11.7
Belgium 10 396 10 674 10 898 10 906 2.7 4.8 4.9
Czech Republic 10 212 10 012 9 812 8 894 -2.0 -3.9 -12.9
Denmark 5 398 5 498 5 557 5 430 1.9 2.9 0.6
Germany 82 532 82 864 82 108 74 642 0.4 -0.5 -9.6
Estonia 1 351 1 279 1 224 1 126 -5.3 -9.4 -16.6
Greece 11 041 11 390 11 394 10 632 3.2 3.2 -3.7
Spain 42 345 45 264 45 556 42 834 6.9 7.6 1.2
France5 59 901 62 616 64 392 65 704 4.5 7.5 9.7
Ireland 4 028 4 555 4 922 5 478 13.1 22.2 36.0
Italy 57 888 58 630 57 751 52 709 1.3 -0.2 -8.9
Cyprus 730 828 897 975 13.3 22.8 33.5
Latvia 2 319 2 174 2 068 1 873 -6.3 -10.8 -19.2
Lithuania 3 446 3 258 3 134 2 881 -5.5 -9.1 -16.4
Luxembourg 452 499 544 643 10.4 20.5 42.3
Hungary 10 117 9 834 9 588 8 915 -2.8 -5.2 -11.9
Malta 400 439 468 508 9.8 17.0 27.1
Netherlands 16 258 16 957 17 429 17 406 4.3 7.2 7.1
Austria 8 114 8 358 8 501 8 216 3.0 4.8 1.3
Poland 38 191 37 429 36 836 33 665 -2.0 -3.5 -11.8
Portugal 10 475 10 762 10 730 10 009 2.7 2.4 -4.4
Slovenia 1 996 2 019 2 014 1 901 1.1 0.9 -4.8
Slovakia 5 380 5 309 5 237 4 738 -1.3 -2.7 -11.9
Finland 5 220 5 354 5 439 5 217 2.6 4.2 -0.1
Sweden 8 976 9 373 9 769 10 202 4.4 8.8 13.7
United Kingdom 59 652 61 934 63 792 64 330 3.8 6.9 7.8
Bulgaria 7 801 7 130 6 465 5 094 -8.6 -17.1 -34.7
Romania 21 711 20 917 19 746 17 125 -3.7 -9.1 -21.1
Population structure – Main age groups
Percentage aged 0-14 Percentage aged 15-64 Percentage aged 65+
2004 2025 2050 2004 2025 2050 2004 2025 2050
EU25 16.4 14.4 13.4 67.2 63.0 56.7 16.4 22.6 29.9
EU15 16.3 14.4 13.5 66.7 62.8 56.5 17.0 22.8 30.0
New Member States 16.7 14.4 13.2 69.7 64.5 57.7 13.6 21.1 29.1
Belgium 17.3 15.6 14.7 65.6 61.9 57.6 17.1 22.5 27.7
Czech Republic 15.2 13.5 12.6 70.8 64.1 56.5 14.0 22.4 30.9
Denmark 18.9 15.9 15.7 66.2 62.9 60.2 14.9 21.2 24.1
Germany 14.7 12.9 11.9 67.3 62.5 56.5 18.0 24.6 31.6
Estonia 16.0 16.2 14.8 67.9 63.9 59.6 16.1 19.9 25.6
Greece 14.5 13.3 12.3 67.7 63.9 55.2 17.8 22.8 32.5
Spain 14.5 12.8 11.5 68.6 65.2 52.9 16.9 22.0 35.6
France5 18.6 16.7 15.8 65.1 60.9 57.0 16.3 22.4 27.2
Ireland 20.9 18.2 16.0 68.0 65.3 57.8 11.1 16.5 26.2
Italy 14.2 12.1 11.2 66.6 62.9 53.5 19.2 25.0 35.3
Cyprus 20.0 15.6 13.3 68.1 65.2 60.5 11.9 19.2 26.2
Latvia 15.4 16.2 14.8 68.4 64.1 59.1 16.2 19.7 26.1
Lithuania 17.7 15.1 13.7 67.3 65.7 59.6 15.0 19.2 26.7
Luxembourg 18.8 17.1 16.6 67.1 64.9 61.3 14.1 18.0 22.1
Hungary 15.9 14.3 13.8 68.6 63.7 58.1 15.5 22.0 28.1
Malta 18.2 15.6 14.5 68.7 63.1 60.8 13.1 21.3 24.7
Netherlands 18.5 16.1 15.8 67.6 63.3 60.7 13.9 20.6 23.5
Austria 16.3 13.8 12.3 68.2 64.1 57.3 15.5 22.1 30.4
Poland 17.2 14.6 13.0 69.8 64.3 57.6 13.0 21.1 29.4
Portugal 15.7 14.2 13.1 67.4 63.7 55.0 16.9 22.1 31.9
Slovenia 14.6 13.4 12.8 70.4 63.8 56.0 15.0 22.8 31.2
Slovakia 17.6 14.0 12.8 70.9 67.1 57.9 11.5 18.9 29.3
Finland 17.6 16.0 15.3 66.8 59.4 57.8 15.6 24.6 26.9
Sweden 17.8 17.1 16.3 65.0 60.7 59.4 17.2 22.2 24.3
United Kingdom 18.3 16.1 14.7 65.7 63.0 58.7 16.0 20.9 26.6
Bulgaria 14.2 11.7 11.5 68.7 64.5 55.0 17.1 23.8 33.5
Romania 16.4 14.1 12.5 69.1 66.9 57.9 14.5 19.0 29.6
Indicators of population structure
Young dependency ratio3 (%) Elderly dependency ratio2 (%) Total dependency ratio4 (%)
2004 2025 2050 2004 2025 2050 2004 2025 2050
EU25 24.4 22.9 23.7 24.5 35.7 52.8 48.9 58.7 76.5
EU15 24.5 23.0 23.9 25.5 36.3 53.2 50.0 59.3 77.1
New Member States 24.0 22.4 22.8 19.6 32.7 50.4 43.5 55.1 73.2
Belgium 26.4 25.2 25.4 26.1 36.5 48.1 52.5 61.7 73.5
Czech Republic 21.5 21.1 22.2 19.7 35.0 54.8 41.2 56.1 77.1
Denmark 28.5 25.3 26.0 22.5 33.8 40.0 51.0 59.1 66.0
Germany 21.9 20.7 21.1 26.8 39.3 55.8 48.7 60.0 76.9
Estonia 23.6 25.3 24.8 23.8 31.3 43.1 47.4 56.6 67.9
Greece 21.4 20.9 22.3 26.4 35.5 58.8 47.8 56.4 81.1
Spain 21.2 19.7 21.7 24.6 33.6 67.5 45.8 53.3 89.2
France5 28.5 27.4 27.7 25.2 36.9 47.9 53.7 64.3 75.6
Ireland 30.7 27.9 27.7 16.4 25.2 45.3 47.1 53.0 73.0
Italy 21.3 19.3 21.0 28.9 39.7 66.0 50.2 59.0 86.9
Cyprus 29.4 24.0 22.0 17.5 29.3 43.2 46.9 53.3 65.2
Latvia 22.5 25.2 25.0 23.6 30.7 44.1 46.1 55.9 69.1
Lithuania 26.2 23.1 23.0 22.3 29.2 44.9 48.6 52.2 67.8
Luxembourg 28.0 26.4 27.1 21.0 27.7 36.1 49.0 54.1 63.3
Hungary 23.1 22.4 23.7 22.6 34.5 48.3 45.7 56.9 72.0
Malta 26.5 24.7 23.9 19.0 33.8 40.6 45.5 58.4 64.6
Netherlands 27.4 25.4 26.1 20.5 32.5 38.6 47.9 57.9 64.7
Austria 23.9 21.5 21.5 22.8 34.5 53.2 46.7 56.0 74.6
Poland 24.7 22.6 22.6 18.6 32.8 51.0 43.3 55.4 73.5
Portugal 23.3 22.3 23.8 24.9 34.7 58.1 48.3 57.0 81.9
Slovenia 20.8 21.1 22.9 21.4 35.8 55.6 42.1 56.9 78.5
Slovakia 24.8 20.9 22.2 16.3 28.1 50.6 41.0 49.0 72.9
Finland 26.4 27.0 26.4 23.3 41.4 46.7 49.7 68.3 73.1
Sweden 27.4 28.2 27.5 26.4 36.5 40.9 53.8 64.6 68.4
United Kingdom 27.8 25.5 25.0 24.3 33.2 45.3 52.1 58.7 70.3
Bulgaria 20.6 18.1 21.0 24.9 36.9 60.9 45.5 55.0 81.9
Romania 23.8 21.0 21.6 20.9 28.5 51.1 44.6 49.5 72.6
The Deagel corporation is a minor branch of US military intelligence, one of the many secretive organizations which collects data for high-level decision-making purposes and prepares confidential briefing documents for agencies like the National Security Agency, the United Nations, and the World Bank. It is known, for example, to have contributed to a Stratfor report on North Korea. With this kind of pedigree, Deagel should be seen as a legitimate player in the intelligence community and not merely a disinformation asset. If so, then it must be assumed that its population predictions for 2025, as well as its industrial output predictions on a nation-by-nation basis, are based on strategic assumptions which are shared and well understood by other players in the intelligence community.
On 4/20/21, Deagel.com deleted their mysterious 2025 forecast spreadsheet that predicted a major collapse of the western countries but I have saved some archive links. The first one is interactive like it was when it existed on the Deagel website:
https://web.archive.org/web/20200629112402/http://www.deagel.com/country/forecast.aspx
https://www.thevoid.uk/void-post/deagel-2025-population-and-output-forecast-revisited-essential-guide/
PDF: https://www.ahava528.com/wp-content/uploads/2021/09/Deagel-Analysis-updated.pdf
As you can see from their current website this information is no longer there: https://deagel.com/
Info on the NWO/Great Reset: https://therealtruthnetworkcom.wordpress.com/2022/04/20/agenda-21-nwo/
Deagel Forecast
Country Pop. 2017 Pop. 2025 Pop. Change GDP Change ME Change PPP Change
United Kingdom 63,390,000 14,517,860 -77.1 -92.1 -97.7 -0.8
Ireland 4,770,000 1,318,740 -72.4 -88.9 -97.7 -0.7
United States of America 316,440,000 99,553,100 -68.5 -85.4 -95.6 -0.7
Puerto Rico 3,640,000 1,165,780 -68.0 -77.6 -0.3
Germany 80,590,000 28,134,920 -65.1 -83.0 -93.3 -0.7
Luxembourg 514,862 199,020 -61.3 -90.4 -97.8 -0.8
Israel 7,710,000 3,982,480 -48.3 -74.2 -89.3 -0.7
Libya 6,000,000 3,253,820 -45.8 -75.6 -0.7
Iceland 339,747 195,927 -42.3 -83.2 -96.0 -0.7
France 67,100,000 39,114,580 -41.7 -58.1 -81.5 -0.6
Spain 47,370,000 27,763,280 -41.4 -59.0 -81.8 -0.5
Bahrain 1,410,000 837,800 -40.6 -49.8 -75.9 -0.6
Cyprus 1,220,000 791,720 -35.1 -45.3 -57.9 -0.5
Australia 23,230,000 15,196,600 -34.6 -69.8 -90.1 -0.6
Angola 29,310,000 19,564,500 -33.2 10.8 13.4 -0.1
Switzerland 7,990,000 5,342,540 -33.1 -66.4 -84.8 -0.4
Denmark 5,600,000 3,771,760 -32.6 -56.3 -72.2 -0.5
Belgium 11,490,000 8,060,900 -29.8 -32.5 -55.2 -0.4
Austria 8,750,000 6,215,000 -29.0 -34.7 -61.2 -0.5
Ukraine 44,570,000 31,628,980 -29.0 -34.6 -50.3 -0.3
Italy 61,480,000 43,760,260 -28.8 -36.7 -63.0 -0.3
Malta 409,836 295,243 -28.0 -23.5 -54.4 -0.2
Syria 22,460,000 16,201,040 -27.9 -19.9 16.4 -0.3
Canada 35,620,000 26,315,760 -26.1 -35.9 -60.6 -0.5
Sweden 9,650,000 7,191,400 -25.5 -57.1 -78.8 -0.5
Estonia 1,250,000 932,320 -25.4 -14.4 -37.1 -0.3
Greece 10,770,000 8,055,960 -25.2 -39.4 -62.1 -0.4
Portugal 10,790,000 8,113,860 -24.8 -19.9 -43.9 -0.1
New Zealand 4,360,000 3,290,300 -24.5 -59.9 -83.2 -0.5
Country Pop. 2017 Pop. 2025 Pop. Change GDP Change ME Change PPP Change
Norway 5,080,000 3,833,960 -24.5 -66.3 -79.8 -0.5
South Korea 48,950,000 37,092,820 -24.2 -25.6 -59.2 -0.4
Moldova 3,620,000 2,750,860 -24.0 -2.5 -8.7 0.0
Lithuania 3,510,000 2,709,640 -22.8 10.3 36.4 0.2
Saint Lucia 162,781 127,192 -21.9 -5.7 -0.2
Barbados 292,336 229,598 -21.5 -22.1 -0.3
Taiwan 23,300,000 18,538,200 -20.4 -6.5 -29.1 -0.1
Latvia 2,180,000 1,755,520 -19.5 8.2 31.1 0.3
Japan 127,250,000 103,047,280 -19.0 -39.0 -63.7 -0.4
Belarus 9,550,000 7,863,440 -17.7 14.4 -28.8 -0.4
Serbia 7,240,000 5,966,200 -17.6 2.5 -39.6 0.0
New Caledonia 264,022 218,667 -17.2 -37.0 0.2
Bahamas 329,988 273,460 -17.1 -20.2 -0.3
Micronesia 106,104 89,473 -15.7 -81.2 -0.6
Uruguay 3,320,000 2,818,460 -15.1 -20.3 -59.2 -0.4
United Arab Emirates 5,470,000 4,664,700 -14.7 -52.2 -77.4 -0.1
Trinidad and Tobago 1,220,000 1,044,320 -14.4 -21.4 -21.1 -0.2
El Salvador 6,170,000 5,291,860 -14.2 7.6 9.2 -0.1
Bulgaria 7,100,000 6,128,360 -13.7 59.2 46.8 0.0
Qatar 2,040,000 1,764,240 -13.5 -54.0 -81.3 -0.5
Poland 38,380,000 33,230,780 -13.4 -18.4 -38.2 -0.1
Slovenia 1,990,000 1,723,800 -13.4 -7.5 -30.1 0.0
Croatia 4,290,000 3,754,250 -12.5 -7.4 -2.8 -0.2
Tanzania 48,260,000 42,526,920 -11.9 143.4 130.0 0.5
Equatorial Guinea 778,358 688,511 -11.5 16.9 -5.0 -0.4
Haiti 10,650,000 9,439,880 -11.4 18.5 -0.4
Turkey 80,690,000 71,556,440 -11.3 -4.9 -48.3 -0.2
Kuwait 2,690,000 2,401,080 -10.7 -43.8 -68.5 -0.2
Lesotho 1,940,000 1,749,080 -9.8 9.2 -22.9 -0.1
Burkina Faso 20,110,000 18,227,580 -9.4 113.7 143.8 0.2
North Macedonia 2,100,000 1,903,800 -9.3 67.8 67.2 -0.1
Country Pop. 2017 Pop. 2025 Pop. Change GDP Change ME Change PPP Change
Singapore 5,460,000 4,958,900 -9.2 -33.3 -58.8 -0.2
Montenegro 653,474 596,753 -8.7 74.3 45.2 0.6
Burundi 11,470,000 10,516,440 -8.3 104.3 106.7 0.2
Eswatini 1,470,000 1,358,340 -7.6 64.9 91.7 -0.3
Czechia 10,670,000 9,873,060 -7.5 0.8 0.5 -0.1
Slovakia 5,490,000 5,078,180 -7.5 6.6 0.3 0.2
Argentina 44,290,000 41,008,200 -7.4 -1.6 -27.4 -0.2
Aruba 115,120 107,067 -7.0 -1.6 0.1
Albania 3,050,000 2,840,580 -6.9 91.0 76.1 0.0
Bosnia and Herzegovina 3,860,000 3,613,500 -6.4 41.3 50.3 -0.1
Saudi Arabia 26,940,000 25,297,620 -6.1 -21.4 -35.6 0.0
South Africa 48,600,000 45,945,100 -5.5 -8.0 -42.8 -0.2
Armenia 3,050,000 2,891,200 -5.2 27.2 6.9 -0.2
Benin 11,040,000 10,493,240 -5.0 103.0 86.0 0.2
Jamaica 2,910,000 2,763,480 -5.0 9.5 -9.8 -0.2
Liberia 3,990,000 3,789,280 -5.0 10.3 -25.0 -0.1
World 7,226,458,211 6,871,665,908 -4.9 -15.9 -38.7 -0.2
Hungary 9,850,000 9,378,040 -4.8 37.2 15.1 0.0
Ecuador 16,290,000 15,519,180 -4.7 16.8 61.0 -0.1
Finland 5,520,000 5,268,640 -4.6 8.8 8.2 -0.1
Ethiopia 105,350,000 100,710,020 -4.4 109.4 150.7 0.1
Georgia 4,930,000 4,724,560 -4.2 68.7 67.3 -0.3
Guinea 12,410,000 11,896,000 -4.1 3.1 -34.9 -0.4
Suriname 566,846 543,830 -4.1 3.5 16.7 0.1
Thailand 67,500,000 64,978,140 -3.7 96.7 91.7 0.8
Romania 21,790,000 21,014,080 -3.6 84.4 85.0 0.7
Azerbaijan 9,960,000 9,630,860 -3.3 182.9 239.4 -0.1
Saint Vincent and the Grenadines 103,220 99,763 -3.3 34.5 0.1
Somalia 10,250,000 9,940,700 -3.0 150.4 -100.0 -0.3
Belize 360,346 351,422 -2.5 3.7 -19.0 -0.1
Cuba 11,150,000 10,871,820 -2.5 32.4 25.6 -0.1
Country Pop. 2017 Pop. 2025 Pop. Change GDP Change ME Change PPP Change
Fiji 920,938 899,721 -2.3 8.2 32.7 -0.2
Gambia 2,050,000 2,007,240 -2.1 76.1 0.0 -0.2
Cameroon 24,990,000 24,507,400 -1.9 116.7 92.6 0.1
Democratic Republic of Congo 83,300,000 81,698,120 -1.9 9.8 20.3 0.0
Brunei Darussalam 443,593 435,478 -1.8 88.3 39.4 0.0
Afghanistan 34,120,000 33,539,680 -1.7 448.9 3,284.5 1.6
Guyana 737,718 725,063 -1.7 22.7 3.9 0.0
Tunisia 10,830,000 10,644,240 -1.7 11.8 -15.6 -0.3
China 1,380,000,000 1,358,440,000 -1.6 42.1 37.0 0.1
Tonga 106,322 104,961 -1.3 30.8 -0.2
Grenada 111,724 110,668 -0.9 23.5 0.2
Russia 142,500,000 141,830,780 -0.5 104.9 98.3 1.4
Iran 82,020,000 81,976,680 -0.1 92.2 62.1 -0.3
Kiribati 103,248 103,179 -0.1 45.7 -0.5
Maldives 393,988 390,153 -1.0 98.9 28.6 0.7
Netherlands 16,800,000 16,809,740 0.1 7.2 -4.8 0.1
Brazil 207,350,000 210,314,920 1.4 35.2 36.9 0.0
Mali 15,970,000 16,208,120 1.5 146.7 228.7 1.2
Cape Verde 560,899 569,749 1.6 78.1 45.5 0.1
Chile 17,790,000 18,098,060 1.7 52.7 61.2 0.1
Djibouti 865,267 880,573 1.8 54.2 0.3
Ghana 27,500,000 27,991,840 1.8 54.7 44.5 -0.2
Eritrea 5,920,000 6,048,240 2.2 4.2 -0.3
Samoa 195,476 199,745 2.2 56.2 0.1
Kazakhstan 17,740,000 18,141,480 2.3 -1.7 -30.7 0.2
Botswana 2,210,000 2,262,280 2.4 52.9 11.9 -0.1
Indonesia 260,580,000 267,136,480 2.5 80.6 60.7 -0.2
Venezuela 28,460,000 29,243,520 2.8 -24.7 -55.8 -0.3
Chad 12,070,000 12,431,280 3.0 126.7 89.6 0.1
Colombia 47,700,000 49,240,520 3.2 83.7 74.5 0.1
Mauritius 1,320,000 1,363,960 3.3 40.9 36.4 0.1
Country Pop. 2017 Pop. 2025 Pop. Change GDP Change ME Change PPP Change
Morocco 32,650,000 33,767,920 3.4 99.7 90.7 0.6
Kyrgyzstan 5,550,000 5,753,600 3.7 36.8 229.0 0.0
Bhutan 758,288 787,650 3.9 78.6 -0.1
Malawi 16,770,000 17,488,020 4.3 162.5 76.5 -0.1
Sierra Leone 5,610,000 5,864,940 4.5 23.8 6.1 0.0
Costa Rica 4,930,000 5,154,640 4.6 14.3 -0.1
Dominican Republic 10,730,000 11,228,820 4.6 65.5 52.6 -0.1
Togo 7,150,000 7,477,160 4.6 126.4 136.8 0.7
India 1,280,000,000 1,341,720,000 4.8 110.0 85.7 -0.2
Uganda 34,760,000 36,458,240 4.9 112.0 111.6 0.3
Mexico 118,820,000 124,717,740 5.0 -1.1 -22.0 -0.1
Niger 16,900,000 17,764,280 5.1 125.0 376.6 0.7
Sri Lanka 21,670,000 22,791,540 5.2 159.1 133.1 0.6
Cote d'Ivoire 24,180,000 25,463,460 5.3 82.8 132.6 0.0
Iraq 31,860,000 33,754,520 5.9 62.3 240.4 1.1
Jordan 6,480,000 6,888,740 6.3 29.4 2.8 0.5
Myanmar 55,120,000 58,638,300 6.4 191.1 81.4 -0.2
Algeria 40,970,000 43,638,280 6.5 92.8 22.0 -0.3
Uzbekistan 28,660,000 30,541,480 6.6 108.8 78.7 0.4
Central African Republic 5,620,000 6,005,920 6.9 46.6 0.0
Peru 29,850,000 31,899,960 6.9 28.5 12.7 0.1
Rwanda 12,010,000 12,856,620 7.0 200.6 204.7 0.7
Nicaragua 5,790,000 6,202,240 7.1 71.9 47.9 0.0
Vietnam 92,470,000 99,030,160 7.1 175.7 177.0 0.7
Mongolia 2,910,000 3,118,360 7.2 91.5 50.8 0.7
Nigeria 174,510,000 187,254,300 7.3 142.7 91.2 0.9
Bolivia 11,140,000 11,981,200 7.6 52.0 41.4 -0.1
Gabon 1,770,000 1,904,720 7.6 100.8 78.0 0.1
Cambodia 16,200,000 17,454,060 7.7 119.5 113.6 0.0
Namibia 2,180,000 2,348,840 7.7 18.0 18.6 0.0
Zambia 14,220,000 15,322,840 7.8 39.2 17.2 0.6
Country Pop. 2017 Pop. 2025 Pop. Change GDP Change ME Change PPP Change
Mozambique 24,100,000 26,006,520 7.9 52.5 50.4 0.0
Panama 3,560,000 3,841,600 7.9 41.7 18.5 0.3
Senegal 13,300,000 14,384,940 8.2 101.0 144.1 0.5
Egypt 97,040,000 105,306,900 8.5 133.2 47.4 -0.2
Yemen 25,340,000 27,486,640 8.5 1.7 -23.6 -0.1
Turkmenistan 5,110,000 5,552,820 8.7 41.6 27.5 0.5
Honduras 9,040,000 9,840,640 8.9 30.1 -9.7 -0.2
Paraguay 6,620,000 7,238,960 9.3 43.9 31.6 0.3
Comoros 808,080 885,869 9.6 90.1 0.3
Guatemala 15,460,000 16,963,080 9.7 11.2 4.0 -0.2
Madagascar 22,590,000 24,842,620 10.0 88.1 47.2 0.1
Guinea-Bissau 1,790,000 1,979,800 10.6 95.7 104.5 0.0
Philippines 105,720,000 117,031,940 10.7 147.0 156.2 0.7
Solomon Islands 597,248 663,561 11.1 30.0 16.7 -0.2
Zimbabwe 13,180,000 14,638,960 11.1 45.9 4.9 1.5
Nepal 30,430,000 33,825,620 11.2 196.4 187.1 0.6
Mauritania 3,440,000 3,843,620 11.7 139.1 82.2 0.7
Malaysia 29,630,000 33,358,220 12.6 131.1 125.2 0.8
Bangladesh 157,830,000 178,356,440 13.0 58.5 24.1 -0.2
Pakistan 193,240,000 218,871,280 13.3 249.1 262.8 0.7
Vanuatu 261,565 298,136 14.0 61.6 -0.1
Kenya 44,040,000 50,320,160 14.3 179.5 141.5 1.0
Laos 6,690,000 7,665,700 14.6 210.5 106.5 0.9
Oman 3,150,000 3,616,920 14.8 2.0 5.7 0.1
Tajikistan 7,910,000 9,214,940 16.5 106.4 83.3 0.2
Timor-Leste 1,170,000 1,363,200 16.5 30.1 -1.7 -0.6
Republic of the Congo 4,570,000 5,330,360 16.6 86.6 382.9 0.5
Sudan 34,850,000 40,691,900 16.8 181.5 81.4 0.6
Papua New Guinea 6,430,000 7,571,120 17.7 44.6 41.4 0.1
Sao Tome and Principe 186,817 221,306 18.5 100.6 0.6
Lebanon 4,130,000 6,585,900 59.5 94.3 87.8 0.2
- Forecast For Iran And Most Of Middle East Forecast To Remain About Same
Over the past 9+ years and dating all the way back to October 22nd of 2014, ANP (All News Pipeline) has been reporting upon the absolutely bizarre 'forecast' for America and most of 'Western Civilization' being given by the 'US government sourced website' called the 'Deagel Report' for the near future, a 'forecast' which showed the United States population would be well below 100 million people soon and us looking economically and criminally like a 3rd world nation.
Called a 'crazy conspiracy theory' by the Associated Press and the mainstream media despite Deagel's sources being groups such as the US Department of Defense, the US Department of State, the CIA, the World Bank, the European Union and the US Navy, Army, Coast Guard, Marine Corp and Air Force, we've got to take another look at that forecast with us rapidly closing in on that 'End Date' as we barrel well into World War 3, and the fact that Deagel's forecast for the population of Israel also shows their population expected to be more than cut in half soon.
With Deagel forecasting at one point for the US's population to drop from 323 million+ to barely over 54 million soon as seen in this document at the website 'Pakistan Defense' from January 17th of 2018, a document called by them 'a cautionary tale highlighting weaknesses in our current systems,' take note that while the populations of Israel, the United States and most of Western Civilization are being forecast to tumble, the populations of nations such as Iran, Syria, Turkey as well as most of the Middle East were being forecast to largely stay the same or even increase.
Showing Israel's forecast to drop by a stunning 63.5%, that's nothing compared to the 79.7% forecast population drop for the United States of America, not to mention our forecast military expenditures are absolutely tumbling, as if we're seeing proof the 'US military industrial complex' from the year 2017 KNEW we were going to lose World War 3, and as a punishment by our 'future globalist rulers,' we were going to be 'disarmed' as a nation.
And as we had reported on ANP all the way back in 2014 when we first broke this bizarre forecast to our readers, Deagel also forecasted the United States would be a 3rd world nation soon economically, with our military spending being forecast to drop from $726 billion dollars yearly to only $8 billion dollars in the future, while our GDP per capita was forecast to drop from $52,838 to $13,328.
Also forecasting our gross domestic product to tumble to only $2.4 trillion soon, down from over $19 trillion in 2017, Deagel was largely blaming at the time a future devastating 'economic event' to be behind their forecast though as they also pointed out, global wars have long been drivers of such economic devastation through history.
ANP Emergency Fundraiser: The globalists war on ANP is all part of the globalists 'Big Tech' effort to silence conservative and independent voices, allowing them to maintain a monopoly on the flow of information. As George Orwell made clear to us decades ago, "The further a society drifts from the truth, the more they will hate those who speak it." But, with your amazing help, we at ANP promise to keep 'speaking truth to power' because, as Orwell also reminded us, "If liberty means anything at all it means the right to tell people what they do not want to hear."
With this new story over at The Express that Steve Quayle had linked to on his website earlier Tuesday morning reporting Russian President Vladimir Putin has turned against long time ally Israel, and that he now sees Israel 'as Russia's enemy,' being more proof of the World War 3 battle lines being drawn, take note that Deagel's forecast also saw the populations of both Russia and China staying largely the same, while that of 'Western Civilization' was decimated. Briefly, from this Express story before we continue.:
Vladimir Putin will now see Israel as an "enemy" as he moves closer to Iran and sides with Hamas in the Middle East, a former speechwriter for the Russian President tells Daily Express US.
Hamas has called Russia its “closest friend” as the terror group vows to release eight Russian hostages kidnapped during its October 7 attack in Israel.
Putin appears to be breaking from his previous line of neutrality over Israel and Palestine. This week he called on Israel to cancel its ground invasion into Gaza.
Abbas Gallyamov, a former speechwriter for Putin from 2008-2012 who lives in Tel Aviv, tells Daily Express US that Putin has become more reliant on Iran for weapons, and this is why he has shifted to a more pro-Palestine stance.
He said: "For many years Putin was really skillfully keeping a middle ground between Israel and Iran, but recently Russia became dependent on Tehran because of arms deliveries.
"He lost his chance to be an independent player. It was probably that Iran said 'we support you in Ukraine, you support us in the Middle East'.
"Putin had to follow Tehran. In the Middle East, Russia is quickly turning into another Iran proxy just like Hamas and Hezbollah."
The populations of the UK, the USA, Germany, Israel, France, Spain, Australia, Switzerland, Denmark, Belgium, Austria and numerous other countries were long being forecast to absolutely tumble. So what do the globalists who are behind the Deagel Report's absolutely bizarre forecasts for America and Israel know that the rest of us DON'T know?
December 28th of 2018 a story on ANP titled "If These Numbers From A Deep State Sourced Website Are Correct, America Will Be A 3rd World Nation - Deagel's Forecast Suggests The Depopulation End Game Has Arrived," providing us with Deagel's own explanation for why they were forecasting massive depopulation for Western Civilization.:
There have been many questions about the countries forecast specially the one focusing on the United States of America (USA). They won't be answered one by one but below you can find some explanation, thoughts and reflections. We are going to keep this as short as possible.
The majority of the economic and demographic data used in the making of the forecasts is widely available by institutions such as the CIA, IMF, UN, USG, etc.
The collapse of the Western financial system will wipe out the standard of living of its population while ending ponzi schemes such as the stock exchange and the pension funds. The population will be hit so badly by a full array of bubbles and ponzi schemes that the migration engine will start to work in reverse accelerating itself due to ripple effects thus leading to the demise of the States. This unseen situation for the States will develop itself in a cascade pattern with unprecedented and devastating effects for the economy.
Nevertheless the death toll will be horrible. Take into account that the Soviet Union's population was poorer than the Americans nowadays or even then. The ex-Soviets suffered during the following struggle in the 1990s with a significant death toll and the loss of national pride. Might we say "Twice the pride, double the fall"? Nope. The American standard of living is one of the highest, far more than double of the Soviets while having added a services economy that will be gone along with the financial system. When pensioners see their retirement disappear in front of their eyes and there are no servicing jobs you can imagine what is going to happen next. At least younger people can migrate. Never in human history were so many elders among the population. In past centuries people were lucky to get to their 30s or 40s. The American downfall is set to be far worse than the Soviet Union's one. A confluence of crisis with a devastating result.
And while the Deagel Report, soon after they published that explanation for why they were forecasting America to be a hugely depopulated, 3rd world nation soon, not only removed it but also removing their entire forecast, take note that they are still putting out military reports for countries all across the planet to this day, and their sources are still the same 'deep state' and globalists from years ago.
And as we'd reported in this July 21st of 2023 story on ANP titled "'Dystopian Fantasy' Coming True Before Our Eyes As Nobel Prize Winner's Dire Warning About 'Global Warming Hoax' Hints Of Massive 'Depopulation' As Warned Of In Deagel 2025 Forecast," we were watching America's collapse and destruction all across the country back then just a few months ago, and it's only getting worse as we move well into World War 3 though the mainstream media will never admit that.
With the destruction of America now easily seen in one big city after another, where mindless zombies are roaming around downtown areas, arms hanging low and no signs of life left what-so-ever in their faces or their spirits, we're already well on our way towards America being a 3rd world nation.
And with all of those cities being run by 'corrupt politicians' proving to us that they have no intention at all of truly HELPING 'people,' for if they did, they'd be spending money TRAINING them for jobs and careers rather than spending that money on free programs, it's not too difficult to see what this country will look like as a 3rd world nation.
Murders, street crime, white-collar crime, shoplifting, trespassing, abuse of power, illegal drugs, legal drugs, illegal immigration and open borders, election-tampering, institutional decay, homelessness, illiteracy, phony racism, real racism, corrupt politicians, vengeful district attorneys, child abuse, domestic partner abuse, disregard for human life, a weakened military, the rise of authoritarianism, expanding ignorance, AI, CRT, DIE, poverty, inflation, radical environmentalism, gender fluidity, lowered standards and weakened values, flight from personal responsibility, death of the meritocracy...the list goes on, and it's getting bigger by the day.
So with the Deagel Report over many years showing an absolutely bizarre 'forecast' for America, Israel and most of Western Civilization; the Deagel Report that composed those reports being 'sourced' by the 'deep state' here in America, including numerous United States government agencies; and those reports showing America, and Israel, completely 'depopulated' soon; and America and the world now only a little over one year away from that bizarre 'end times date,' we pray for everybody reading this, and Americans and people across the world, that God is with you, and gives each and every one of you, the strength and perseverance you'll need to make it through to the other side.
Deagel Makes Mysterious Changes To 2025 Population Forecast For America As Bill Gates Launches ‘Grand Challenge’.
The ‘Holy Grail Of Influenza Research’ And ‘Bridging The Valley Of Death’
While Microsoft founder and vaccine propagandist Bill Gates recently warned that the next deadly flu epidemic is just waiting around the corner and it could quickly lead to the deaths of more than 30 million people, we’re not the least bit surprised that he also claims a ‘universal flu shot’ is the answer to prevent such a deadly pandemic, this despite the fact that even medical experts claimed that this year’s flu shot was hardly a preventive and actually led to the spread of the flu.
With the Bill and Melinda Gates Foundation teaming up with Google co-founder Larry Page to launch the ‘Grand Challenge’ of what they call the ‘holy grail of influenza research‘, an attempt to develop a ‘universal vaccine‘, Gates and Page are giving out individual grants of between $250,000 and $2 million over 2 years to those attempting to develop such a universal flu shot with human testing set to begin by 2021.
Calling upon computational biology, bioinformatics, artificial intelligence, machine learning and other new technologies to be used as aids in the ongoing research, Gates and Page hope to ‘bridge the funding‘ of such projects due to what they call the “valley of death” between novel concepts and clinical trial-ready products.
And while like many globalists, Gates and Page sound ‘sincere’ in their goals to prevent the spread of an epidemic that could cull tens of millions of lives, we must always remember that Gates and the Gates Foundation are also proponents of eugenics with Gates himself coming out directly and stated the world is far too overpopulated, while his father, William H Gates Sr., was a former board member of ‘Planned Parenthood’.
Bill Gates has doubled down on his goal to depopulate the planet, using deceitful Orwellian doublespeak in a new video to bamboozle his naive followers into believing that “by making people healthier, we can reduce the world’s population”.
Make no mistake, when Gates talks about “making people healthier” what he is really talking about is enforcing the mandatory roll out of his range of experimental vaccinations. The same vaccines that have already caused mass sterilization and death on multiple continents.

The second-richest man on the planet is a committed globalist and eugenicist working towards the New World Order goal of depopulation. Lest anyone forget these facts, Bill Gates regularly goes out of his way to remind us of them.
Bill Gates and his foundation have consistently come under fire for their goal of depopulation, and now the same man who admitted in a TED talk that his goal is to eliminate a billion humans from the face of the Earth has now taken to Facebook to lecture us about why being eradicated is in our own interests.
And while the website Deagel.com has recently made some very mysterious changes to their 2025 forecast for America as we report in much more detail below, as we hear in the video from the Leak Project and read in a March story from The Sun, one medical health expert is warning of a mutant virus that sounds straight from a science fiction movie, potential becoming the fastest-spreading viral killer known to the human race and as he tells us, such a killer virus outbreak could happen tomorrow.
Dr Jonathan Quick, chair of the Global Health Council, said the flu virus is “the most diabolical, hardest-to-control, and fastest-spreading potential viral killer known to humankind”.
Describing what sounds like scenes from a horror film, Dr Quick warned in The Daily Mail of starvation, medicine supplies running low, energy systems crippling under the pressure and the collapse of the global economy.
And what’s could cause such devastation, on a global scale?
“The most likely culprit will be a new and unprecedentedly deadly mutation of the influenza virus. The conditions are right, it could happen tomorrow.”
And while the website Deagel.com is STILL forecasting a massive depopulation for America, on our visit to their website recently we found a huge difference in their forecast.
As we had reported on ANP back on December 31st of 2017, Deagel was previously forecasting the US population to drop to 54 million people soon, down from what was then 324 million people in 2016. Deagel is now forecasting that the future population of the USA will be a nice, round 100 million people – nearly doubling their previous forecast for America of 54 million.
Yet as it’s easy to see, even a forecast of 100 million people living here in less than 8 years is STILL DOWN 227 million from the 2017 population of America. How will America LOSE 227 million people?
We’d love to know why Deagel is forecasting the population of the US to drop from 327 million in 2017 to only 100 million, with them also forecasting a US military budget of 32 billion dollars, down from our 2017 military budget of $637 billion, while forecasting our population density to drop from 34 inhabitants per square mile to only 10 inhabitants per square mile in the near future. What does Deagel know that we don’t know?
Also forecasting that our gross domestic product will drop from $19 trillion in 2017 to only $2.4 trillion soon, Deagel’s numbers for America still show an America in total collapse, a 3rd world nation with our GDP per capita more than cut in half while our purchase power parity is forecast to be lower than Thailand, Columbia, Bulgaria, Croatia and Montenegro.
And before you go and discount Deagel’s numbers, its very important to know that their sources ARE the ‘deep state’ with the CIA, US Department of Defense, US Department of State and World Bank contributing data for their forecasts. So…. what does Deagel know what we don’t know? Their sources make clear that whatever Deagel knows, the ‘deep state’ knows, too!
While Deagel leaves no explanation on their website about why they’ve made these changes to their forecast population of America, as we’ve previously reported, they did put out an explanation back in October of 2014 about why they were forecasting such a huge drop for America, ‘a confluence of crisis’ with a devastating result‘. A brief excerpt from that 2014 explanation:
The key element to understand the process that the USA will enter in the upcoming decade is migration. In the past, specially in the 20th century, the key factor that allowed the USA to rise to its colossus status was immigration with the benefits of a demographic expansion supporting the credit expansion and the brain drain from the rest of the world benefiting the States.
The collapse of the Western financial system will wipe out the standard of living of its population while ending ponzi schemes such as the stock exchange and the pension funds. The population will be hit so badly by a full array of bubbles and ponzi schemes that the migration engine will start to work in reverse accelerating itself due to ripple effects thus leading to the demise of the States. This unseen situation for the States will develop itself in a cascade pattern with unprecedented and devastating effects for the economy. Jobs offshoring will surely end with many American Corporations relocating overseas thus becoming foreign Corporations!!!!
We see a significant part of the American population migrating to Latin America and Asia while migration to Europe – suffering a similar illness – won’t be relevant. Nevertheless the death toll will be horrible. Take into account that the Soviet Union’s population was poorer than the Americans nowadays or even then. The ex-Soviets suffered during the following struggle in the 1990s with a significant death toll and the loss of national pride. Might we say “Twice the pride, double the fall”? Nope.
The American standard of living is one of the highest, far more than double of the Soviets while having a services economy that will be gone with the financial system. When pensioners see their retirement disappear in front of their eyes and there are no servicing jobs you can imagine what is going to happen next. At least younger people can migrate. Never in human history were so many elders among the population. In past centuries people were lucky to get to their 30s or 40s. The American downfall is set to be far worse than the Soviet Union’s one. A confluence of crisis with a devastating result.
And while their expected culling of 227 million Americans isn’t quite as many as they were forecasting just weeks ago, they are still forecasting a huge drop for America’s population within less than 8 years, a population drop-off which is still unadequately explained, even using their 2014 explanation seen in the previous section of this story above.
While the mainstream media and gatekeepers such as snopes will continue to call the globalists depopulation agenda a ‘conspiracy theory’ despite the fact that its written in granite upon the mysterious Georgia Guidestones that were recently blown up and now removed, we hear from videographer Truth Happens about Gates plans for a universal vaccine with our videographer also talking with us about the globalists depopulation agenda.
And in the final video from videographer ‘Leak Project’ about the suspect ‘mutant virus’ on the loose that some warn could eventually lead to the deaths of 300 million or more, with medical experts warning the conditions for such a deadly outbreak are perfect despite the fact that they still don’t even know exactly what will cause this ‘outbreak’.
BILL GATES CONTRIBUTIONS TO VACCINES:
Bill Gates, the Microsoft founder turned philanthropist has spent billions to help bring vaccines to the developing world, working closely with pharmaceutical executives to transform the market. In doing so, he has become one of the more powerful — and provocative — private player in global health.
THE PAST:
The GAVI Alliance celebrated the tenth anniversary of its foundation on Jan 29 this year 2010. During its 10 years GAVI has overseen the delivery of vaccines to around 250 million children in the world's poorest countries.
To mark GAVI's birthday, the Bill and Melinda Gates Foundation announced that it will commit US$10 billion over the next 10 years to a so-called decade of vaccines—ie, research and development and delivery of vaccines to the world's poorest. As an agency whose role is vaccine delivery, rather than research and development, it is not clear how much of the Gates billions will be coming to GAVI. However, GAVI is already the foundation's largest grantee, having received $1·5 billion in its 10 year history.
Other major GAVI donors are national governments, of which 16 have contributed to the alliance plus the European Commission. Countries that have donated the most to GAVI's core funding include Canada, the Netherlands, Norway, the UK, and the USA. Although the direct donation made by Gates far outstrip those made by any national government, France and the UK have committed billions of dollars to a funding mechanism called the International Finance Facility for Immunization and other governments have promised substantial amounts to this scheme.
GAVI currently disburses around $1 billion per year among the 65 countries in which it supports vaccination programmes. The alliance focuses its activities on delivery of a childhood pentavalent vaccine that protects against diphtheria, tetanus, pertussis, hepatitis B, and Haemophilus influenzae type b. However, to roll out this vaccine to all 65 countries by 2015, plus achieve its goal of adding pneumococcal and rotavirus vaccines to the immunisation schedule, will require an additional $3 billion.
A lot more than just wishful thinking has gone into Gates' decision to donate $10 billion. A model developed at the Johns Hopkins Bloomberg School of Public Health (Baltimore, MD, USA), indicated that 90% vaccine coverage—including the rotavirus and pneumococcal vaccines—would prevent the deaths of 7·6 million children younger than 5 years between now and 2020. Adding the malaria vaccine, which is undergoing clinical trials, from 2014 could save an additional 1·1 million lives. The Gates Foundation will certainly not be funding this expansion in vaccine coverage on its own, but its financial commitment should act as an incentive for donor governments to provide the additional funds to achieve 90% coverage with childhood vaccines in developing countries within the next 10 years.
In addition to the diseases already mentioned, vaccination against measles will likely be targeted for some of the Gates' billions. Progress in preventing deaths from measles has been remarkable, with around 82% of those eligible worldwide now receiving vaccine and the number of measles-related deaths falling from around 750 000 in 2000 to 164 000 in 2008. GAVI does not currently fund measles vaccination programmes; rather, another international collaboration, the Measles Initiative, provides technical and financial support for national vaccination programmes in developing countries. Other areas that might benefit include the provision of autodisposable syringes that cannot be reused, funding for new vaccines against group A meningococcal meningitis and against tuberculosis, and perhaps even a final push to eliminate polio.
Although the life-saving benefits of vaccination are beyond question, no immunisation programme is without an element of controversy. As pointed out in Newsdesk, GAVI is optimistic about rolling out pneumococcal vaccine on a large scale to developing countries, because it believes the cost of the vaccine can be reduced by 90%; however, little research has been done on the public health effect of widespread pneumococcal vaccine use in the targeted countries—might there, for example, be replacement of the vaccine pneumococcal serotypes with other serotypes, thus making the vaccine only temporarily effective? Given the present influenza pandemic, some of the Gates money could be spent on researching the effect of influenza in developing countries and, if necessary, developing vaccines against influenza that are cheap enough for widespread use in these countries.
These caveats are, of course, minor compared with the beneficial effect on global health that the commitment made by the Gates Foundation is likely to have. The foundation does need to set out a clear plan for how it intends to disburse its money over the decade of vaccines. Nevertheless, many more national governments than are currently backing global vaccine coverage should be inspired to follow the lead taken by the foundation.
THE FUTURE:
THE GATES FOUNDATION:

The Immunization team applies new perspectives to immunization challenges and funds solutions to improve the delivery of high-quality, affordable vaccines for more equitable coverage. We focus on reaching the most vulnerable children as well as adolescents and adults. We partner with countries, multilateral organizations, the private sector, and civil society organizations to support vaccine introductions that help reach national immunization goals. We particularly focus on high-impact efforts, including HPV vaccine introductions and measles campaigns. We believe that robust and resilient immunization programs are the cornerstone of strong primary health care systems. Our work contributes to Immunization Agenda 2030, a vision and commitment by the global community and countries to extend the full benefits of immunization to all by 2030.
We work to accelerate the introduction and use of Gavi-supported vaccines to save lives, with particular focus on HPV vaccine introductions and measles campaigns that have potential for large-scale impact.
In collaboration with governments and other local, national, and global immunization partners, we work to strengthen immunization systems and delivery pathways to reach underserved communities, including by addressing health system constraints and barriers to care.
We work closely with country leaders, civil society organizations, and other partners to ensure that immunization remains a high priority at the national, regional, and global levels. This work includes mobilizing funding for Gavi, supporting advocates and immunization champions, and ensuring sufficient funding and strong policies to support the introduction and scale-up of vaccines.
The COVID-19 pandemic has reminded the world of the power of vaccines to fight disease, save lives, and create a healthier, safer, and more prosperous future. Now we must rapidly and equitably deliver COVID-19 vaccines to the world. Moving forward, strong immunization systems will be needed to ensure that people everywhere are protected against COVID-19 and other diseases. Ensuring everyone receives the vaccines they need will provide exceptional return on investment and help keep the world safe from future pandemics.
IA2030 envisions a world where everyone, everywhere, at every age, fully benefits from vaccines to improve health and well-being.
Implementation of IA2030 will initially focus on a comprehensive response to the COVID-19 pandemic. An urgent priority is the rapid and equitable scale-up of COVID-19 vaccines in all countries as well as collective action to catch up on missed vaccinations and rebuild essential services.

IMMUNIZATION AGENDA 2030 (A global strategy to leave no one behind) Leave no one behind, by increasing equitable access and use of new and existing vaccines.
Achieving these feats will require global collaboration on an unprecedented scale. The World Health Organization has a role to play as coordinator, but individual countries will also need to put aside national interests and work together for the greater good.
The Gates Foundation, the “biggest funder of vaccines in the world,” has already directly donated more toward the global response to the coronavirus. This includes backing vaccine trials by companies like Inovio Pharmaceuticals, AstraZeneca, and Moderna Inc., all of which are being described as frontrunners in the race to develop the Covid-19 vaccine.
The foundation also co-founded and funds the Coalition for Epidemic Preparedness (CEPI), which is investing up to $480 million in “a wide range of vaccine candidates and platform technologies.”
Moreover, the Gates Foundation invests in these corporations directly.
Since shortly after its founding, the foundation has owned stakes in several drug companies. A recent investigation by The Nation magazine revealed that the Gates Foundation currently holds corporate stocks and bonds in drug companies like Merck, GSK, Eli Lilly, Pfizer, Novartis, and Sanofi.
The foundation’s website even candidly declares a mission to pursue “mutually beneficial opportunities” with vaccine manufacturers.
A global research effort worth tens of billions of dollars is needed to ensure the world is better prepared for the next pandemic, which could be far worse than Covid, Bill Gates has said.
"This year is different — it's unique," Bill Gates said on a conference call with reporters ahead of the release of the Bill & Melinda Gates Foundation's Goalkeepers 2020 report. "The COVID-19 pandemic has not only stopped progress — it's pushed it backwards."
The Microsoft founder said the “completely horrific” death toll and economic damage inflicted by coronavirus should drive funding into projects aimed at improving vaccines, treatments and diagnostic tests that will be needed to contain the next pandemic more effectively.
“You know, we didn’t have vaccines that block transmission. We got vaccines that help you with your health, but they only slightly reduced transmission,” he said. “We need a new way of doing the vaccines.”
Some even believe the COVID-19 pandemic was deliberately engineered by Gates and other ‘global elites’, including the United Nations, to depopulate the world.
This idea is often referred to as ‘The Great Reset’, which was the name of the pandemic recovery initiative by the World Economic Forum (WEF), which meets annually in Davos. While theories about a depopulation conspiracy come in many different stripes, one or all of Gates, the UN and Davos usually feature in them.
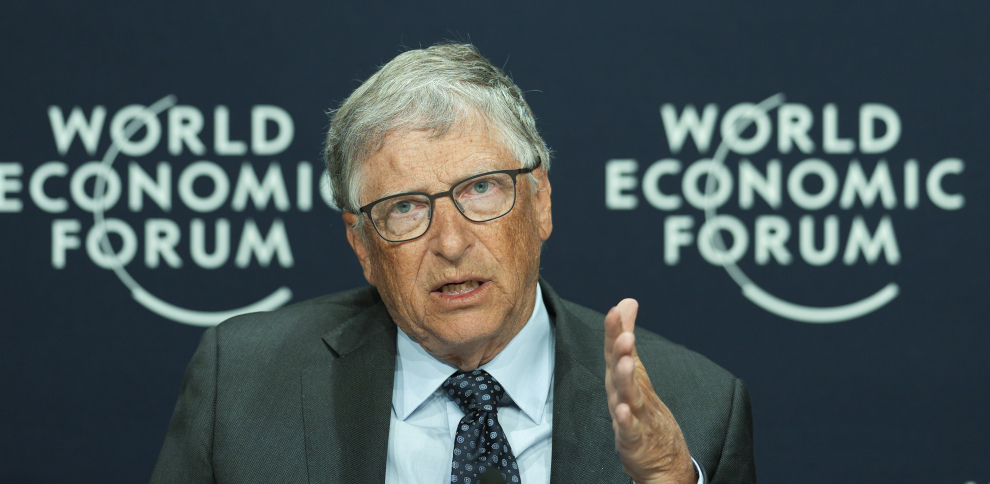
Bill Gates: On Climate Change, It Could Be More Devastating Than The Covid-19 Pandemic
For the world, it will create literally tens of millions of climate refugees, because the closer you are to the equator, the more unlivable that it gets. And so it makes the pandemic look small. The death rate by the end of the century would be over five times the worst of the — what we have had in this pandemic.
Yes, so the power of innovation is very strong in the United States, the universities, the national labs, the willingness to take risks.
And so our responsibility is not just to get rid of our emissions, but also to reduce the cost of being green, to reduce the extra amount, what I call the green premium that you pay when you want to make something like steel or cement in a green fashion.
And those premiums are very, very high. And unless we get them down, the middle-income countries, like India, will continue to have emissions, which means that, as long as you have emissions, sadly, because CO2 stays in the atmosphere for thousands of years, the temperature just keeps going on up.
And that's why zero is what we need.
“As awful as this pandemic is, climate change could be worse.” So says billionaire philanthropist Bill Gates recently.
“A global crisis has shocked the world. It is causing a tragic number of deaths, making people afraid to leave home, and leading to economic hardship not seen in many generations. Its effects are rippling across the world,” Gates wrote. “Obviously, I am talking about COVID-19. But in just a few decades, the same description will fit another global crisis: climate change.”
To prevent the deaths, damage and destruction that will come with a warming planet requires innovation, he said.
That has become more clear than ever before because though the pandemic has brought travel and economic activity almost to a standstill, greenhouse gas emissions still haven’t been reduced enough to stave off the worst ramifications, Gates said.
“What’s remarkable is not how much emissions will go down because of the pandemic, but how little,” Gates wrote. “The relatively small decline in emissions this year makes one thing clear: We cannot get to zero emissions simply—or even mostly—by flying and driving less.” That’s not to say that reducing consumption of fuel that emits carbon gas emissions is not a worthy goal, just that it is not enough, Gates said.
And innovation to fight climate change must start urgently. “Unlike the novel coronavirus, for which I think we’ll have a vaccine next year, there is no two-year fix for climate change. It will take decades to develop and deploy all the clean-energy inventions we need,” Gates wrote.
Global Leaders at COP21
French President François Hollande gestures when posing with world leaders for a photo at the COP21, United Nations Climate Change Conference, in Le Bourget, outside Paris, November 30, 2015.
The Paris Agreement is a legally binding international treaty on climate change. It was adopted by 196 Parties at the UN Climate Change Conference (COP21) in Paris, France, on 12 December 2015. It entered into force on 4 November 2016.
The Agreement sets long-term goals to guide all nations to:
Substantially reduce global greenhouse gas emissions to hold global temperature increase to well below 2°C above pre-industrial levels and pursue efforts to limit it to 1.5°C above pre-industrial levels, recognizing that this would significantly reduce the risks and impacts of climate change
Periodically assess the collective progress towards achieving the purpose of this agreement and its long-term goals
Provide financing to developing countries to mitigate climate change, strengthen resilience and enhance abilities to adapt to climate impacts.
The Agreement is a legally binding international treaty. It entered into force on 4 November 2016. Today, 195 Parties (194 States plus the European Union) have joined the Paris Agreement.
Recognizing the need to accelerate action across all areas – mitigation, adaptation, and finance – by 2030, including a call on governments to speed up the transition away from fossil fuels to renewable energy such as wind and solar power in their next round of climate commitments.
Implementation of the Paris Agreement requires economic and social transformation, based on the best available science.
Also recognizing accelerated action is required to limit global warming to 1.5°C, the COP27 cover decision requests Parties to revisit and strengthen the 2030 targets in their NDCs to align with the Paris Agreement temperature goal by the end of 2023.
Although climate change action needs to be massively increased to achieve the goals of the Paris Agreement, the years since its entry into force have already sparked low-carbon solutions and new markets. More and more countries, regions, cities and companies are establishing carbon neutrality targets. Zero-carbon solutions are becoming competitive across economic sectors representing 25% of emissions. This trend is most noticeable in the power and transport sectors and has created many new business opportunities for early movers.
By 2030, zero-carbon solutions could be competitive in sectors representing over 70% of global emissions.
WHAT'S NEXT FOR BILL GATES:
Gates, the world’s fifth richest man and the second biggest contributor to the World Health Organization, believes we must also strengthen our international cooperation and global health systems to ensure the world is better prepared against biological threats.
The good news is that every little piece of work we do to prepare for future pandemics will be “extremely useful for bioterrorism,” he told the BBC.
The bad news is that “we’re not as activated [...] as I think we should be”.
Gates is also focusing on agriculture, becoming, the largest private owner of farmland in the US. Gates is now particularly active in India’s agriculture, which is currently undergoing a major crisis.
Through his company, Gates Ag One, Gates is pushing for one type of agriculture for the whole world, organized top, down. This includes (digital farming), in which farmers are surveilled and mined for their agricultural data, which is then repackaged and sold back to them.
Digital farming:
The transformation of an essential human activity aimed at feeding humans into a profitable activity aimed primarily at feeding the bank accounts of shareholders in agribusiness monopolies.
BILL GATES'S POST:
"Hey from Denmark, where we’re announcing a new partnership between the Bill & Melinda Gates Foundation, Novo Nordisk Foundation, and Wellcome Trust to support the next generation of solutions to some of the world’s toughest challenges".
"This three-year, $300 million commitment will fund research and development in three key areas: climate and sustainability, infectious diseases, and the interplay between nutrition, immunity, disease, and developmental outcomes. I’m grateful to our partners and to the Gates Foundation team that helped make it happen. Let’s get to work".

The Novo Nordisk Foundation, Wellcome, and the Gates Foundation Join Forces to Accelerate Global Health Equity and Impact.
The Novo Nordisk Foundation, Bill & Melinda Gates Foundation, and Wellcome Trust have announced a new partnership, committing $300 million over three years to stimulate innovative research in developing countries into three of the world’s most critical global health challenges and their interlinkages – including climate change, infectious diseases and antimicrobial resistance (AMR).
The $300 million will also support researchers and institutions in economically disadvantaged areas, a statement said.
The Wellcome Trust is the world’s second largest foundation specialising in the sciences with a portfolio of £36.8 billion. The Gates Foundation endowment stands at $75.2 billion. While Novo Nordisk, a pharma company based in Denmark, has a market value of $570 billion – bigger than the entire Danish economy.
The three foundations hinted at future potential partnerships together.
The initial three areas of this collaboration include:
Climate/sustainability: Advancing climate data, sustainable agriculture, and food systems. To better protect people globally from the devastating effects of climate change on health, solutions that draw across climate, health, and agricultural science will be needed. This initiative will help drive deeper understanding of the impacts of climate change, develop novel solutions, and strengthen available data to support environmental sustainability, build food system resilience, and protect the health of vulnerable populations around the world.
Infectious diseases: Addressing AMR, advancing disease surveillance, and developing vaccines for respiratory infections. As new pathogens emerge, persistent threats like tuberculosis remain, and the prevalence of AMR increases, infectious diseases continue to pose a significant threat to countries and regions around the world. New advances in detection and the development of vaccines and other tools can help reduce the burden of disease in LMICs and prevent outbreaks from turning into global crises.
Interactions: Understanding the interplay between nutrition, immunity, infectious diseases, cardiometabolic and other noncommunicable diseases, and developmental outcomes. Advances in nutritional science and our understanding of the microbiome and immunology create an opportunity to solve for the effects that over- and under-nutrition have on all aspects of health and development, including the risk and severity of cardiometabolic and infectious diseases.
The initiative will support interdisciplinary initiatives that advance, for instance, better collection and use of climate data, innovation in more sustainable agriculture and resilient food systems, and other measures protecting people from climate change, according to a press release by the Bill and Melinda Gates Foundation.
ABOUT THE NOVO NORDISK FOUNDATION

The Novo Nordisk Foundation is an enterprise foundation with philanthropic objectives established in Denmark in 1924. The vision of the Foundation is to improve people’s health and the sustainability of the planet. The Foundation’s mission is to progress research and innovation in the prevention and treatment of cardiometabolic and infectious diseases, as well as to advance knowledge and solutions to support a green transformation of society.
In 2023, the foundation had a net worth of $167 billion, making it the wealthiest charitable foundation in the world.
Concerns have been raised about the potential influence of the Novo Nordisk Foundation's agenda on the direction of scientific research. Critics express concerns about the potential effect of the foundation's allocation of funds on the diversity of research topics and perspectives within the Danish scientific community, as it tends to prioritize projects that align with its strategic goals.
ABOUT WELLCOME
Wellcome is a global charitable foundation, based in the UK. Wellcome supports science to solve the urgent health challenges facing everyone. We support discovery research into life, health, and wellbeing, and we’re taking on three worldwide health challenges: mental health, infectious disease, and climate and health.
ABOUT THE BILL AND MELINDA GATES FOUNDATION
Most people are aware of this organization. The umbrella reach of this organization is incredible and laudatory. And this is all thanks to the efforts of Bill and Melinda Gates. The entity comprises two aspects: Bill and Melinda Gates Foundation and Bill and Melinda Gates Trust.
The organization funds social work in diverse areas, especially toward the upliftment of the underprivileged. Massive funding to third-world countries and their projects had been initiated by the foundation. As a result, the foundation maintains a strong network in several countries.
Gates usually steps in with cash and convinces others, especially public authorities, to support his projects with government funding that will be used to fulfil his, rather than the public’s, agenda. He runs his experiments, always designed as top-down management ventures.
INITIATIVES AND PLANS EVERYONE SHOULD KNOW ABOUT
THE "GREAT RESET"
The Great Reset is the name of an initiative launched by the World Economic Forum (WEF) in June 2020.
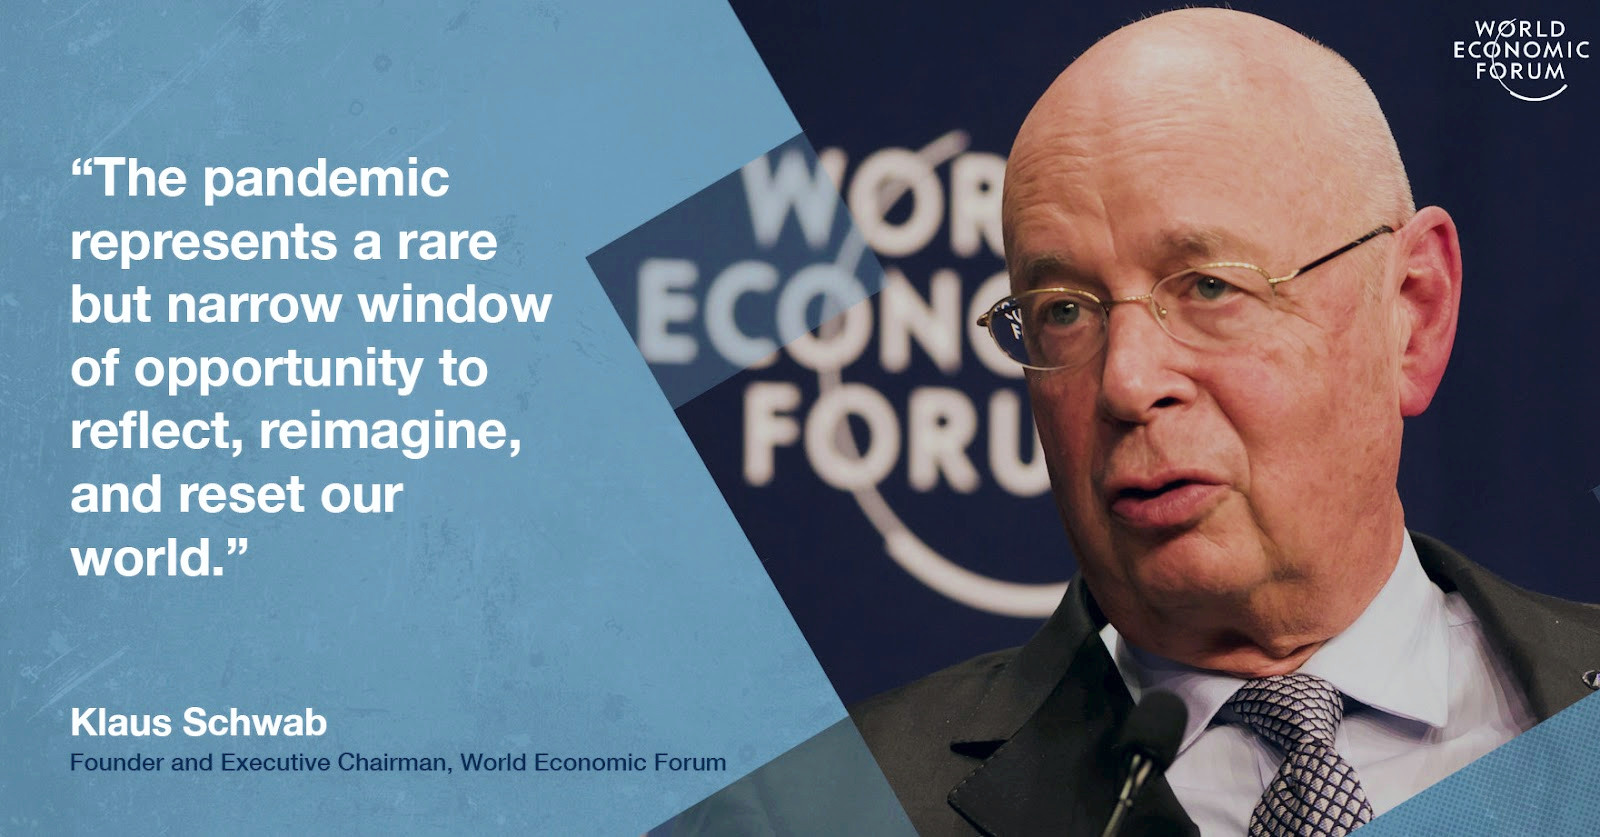
Sustainable Development - - Now is the time for a 'great reset'
From WEF's weforum.org's website ["COVID-19 lockdowns may be gradually easing, but anxiety about the world’s social and economic prospects is only intensifying. There is good reason to worry: a sharp economic downturn has already begun, and we could be facing the worst depression since the 1930s. But, while this outcome is likely, it is not unavoidable".
"To achieve a better outcome, the world must act jointly and swiftly to revamp all aspects of our societies and economies, from education to social contracts and working conditions. Every country, from the United States to China, must participate, and every industry, from oil and gas to tech, must be transformed. In short, we need a “Great Reset” of capitalism".
"Global government debt has already reached its highest level in peacetime".
"Left unaddressed, various crises, together with COVID-19, will deepen and leave the world even less sustainable, less equal, and more fragile. Incremental measures and ad hoc fixes will not suffice to prevent this scenario. We must build entirely new foundations for our economic and social systems".]
Thy're are those that fear the “Great Reset”, using the "COVID-19 or something similar or much worse will serve as an opportunity to roll out radical policies, such as forced vaccination, a digital ID card, a CBDC, and the renunciation of private property.”
Some even claim that the “Great Reset” will lead to “undemocratic governance” and a “NWO.”
Then national sovereignty and individual freedoms will be removed, having been brought about by future catastrophic events like a global pandemic or climate change or a global depression.
Excerpt from COVID-19: THE GREAT RESET, Written by KLAUS SCHWAB, founder and executive Chairman of the World Economic Forum, and THIERRY MALLERET
The worldwide crisis triggered by the coronavirus pandemic has no parallel in modern history. We cannot be accused of hyperbole when we say it is plunging our world in its entirety and each of us individually into the most challenging times we’ve faced in generations. It is our defining moment – we will be dealing with its fallout for years, and many things will change forever. It is bringing economic disruption of monumental proportions, creating a dangerous and volatile period on multiple fronts – politically, socially, geopolitically – raising deep concerns about the environment and also extending the reach of technology into our lives. No industry or business will be spared from the impact of these changes. Millions of companies risk disappearing and many industries face an uncertain future; a few will thrive. A new world will emerge, the contours of which are for us to both imagine and to draw. At the time of writing (June 2020), the pandemic continues to worsen globally. COVID-19 has reminded us that the biggest problems we face are global in nature. More and more often, the big problems besetting us take place beyond the control of even the most powerful nation states; the risks and issues to be confronted are increasingly globalized, interdependent and interconnected, while the global governance capacities to do so are failing perilously, endangered by the resurgence of nationalism. This failure is not the WHO’s fault. The UN agency is merely the symptom, not the cause, of global governance failure. This dysfunctionality is symptomatic of a broken global governance system... the UN and the WHO can be repurposed to address today’s global risks.
THE BUILD BACK BETTER PLAN

Building Back Better, or more frequently termed Build Back Better (BBB), is a strategy aimed at reducing the risk to the people of nations and communities in the wake of future disasters and shocks. It is a conceptual strategy that has continued to evolve since its origination in May 2005.
The World Bank launched its BBB Report in 2018, outlining how to build back from disasters in ways that are stronger (more productive and resilient), faster (limiting the impact of shocks), and more inclusive (ensuring nobody is left behind).
Now, BBB has come to mean the pursuit of a greener, more inclusive and resilient recovery from the COVID-19 crisis. These related elements are essential for countries to make progress toward the Sustainable Development Goals in a world where shocks occur more frequently, with cascading impacts, making resilience and inclusion critical to withstand them.
THE UN'S 2030 AGENDA FOR SUSTAINABLE DEVELOPMENT

In 2015, the United Nations (UN) adopted “The 2030 Agenda for Sustainable Development” and proposed 17 Sustainable Development Goals (SDGs) with the aim of eradicating poverty and promoting peace and prosperity for all on a healthy planet by 2030 (UN, 2015).
We, the Heads of State and Government and High Representatives, meeting at the United Nations Headquarters in New York from 25-27 September 2015 as the Organization celebrates its seventieth anniversary, have decided today on new global Sustainable Development Goals.
On behalf of the peoples we serve, we have adopted a historic decision on a comprehensive, far-reaching and people-centred set of universal and transformative Goals and targets. We commit ourselves to working tirelessly for the full implementation of this Agenda by 2030.
This is an Agenda of unprecedented scope and significance. It is accepted by all countries and is applicable to all, taking into account different national realities, capacities and levels of development and respecting national policies and priorities. These are universal goals and targets which involve the entire world, developed and developing countries alike. They are integrated and indivisible and balance the three dimensions of sustainable development.
Our World Today
Global health threats, more frequent and intense natural disasters, spiralling conflict, violent extremism, terrorism and related humanitarian crises and forced displacement of people threaten to reverse much of the development progress made in recent decades. Natural resource depletion and adverse impacts of environmental degradation, including desertification, drought, land degradation, freshwater scarcity and loss of biodiversity, add to and exacerbate the list of challenges which humanity faces. Climate change is one of the greatest challenges of our time and its adverse impacts undermine the ability of all countries to achieve sustainable development. Increases in global temperature, sea level rise, ocean acidification and other climate change impacts are seriously affecting coastal areas and low-lying coastal countries, including many least developed countries and small island developing States. The survival of many societies, and of the biological support systems of the planet, is at risk.
The New Agenda
We are announcing today 17 Sustainable Development Goals with 169 associated targets which are integrated and indivisible. Never before have world leaders pledged common action and endeavour across such a broad and universal policy agenda. We are setting out together on the path towards sustainable development, devoting ourselves collectively to the pursuit of global development and of "win-win" cooperation which can bring huge gains to all countries and all parts of the world.
All countries and all stakeholders, acting in collaborative partnership, will implement this plan. Aimed at “Leaving No One Behind”.
Means Of Implementation
The scale and ambition of the new Agenda requires a revitalized Global Partnership to ensure its implementation. We fully commit to this. This Partnership will work in a spirit of global solidarity, in particular solidarity with the poorest and with people in vulnerable situations. It will facilitate an intensive global engagement in support of implementation of all the Goals and targets, bringing together Governments, the private sector, civil society, the United Nations system and other actors and mobilizing all available resources.
A Call For Action To Change Our World
Seventy years ago, an earlier generation of world leaders came together to create the United Nations. From the ashes of war and division they fashioned this Organization and the values of peace, dialogue and international cooperation which underpin it. The supreme embodiment of those values is the Charter of the United Nations.